Developers like me, often need to Profile the Plugin so see what logic you are implementing and this is pretty common in the development lifecycle. But, Let’s say you don’t have the classic UI at your disposal and need to download the Profiler from the Unified Interface itself – Here’s a little detour you’ll need to take to get it right.
Alternatively, using Persist To Entity is also preferred. But example – if you have a plugin on Create and on PreOperation, you won’t want to record to be created, you can go with the below –
Ease of the Classic UI
On the classic UI, you would get the Profiled file correctly just by Download Log File button on the interface itself.

And the file has correct data starting with –

And ending with

Profiler Message on the Unified Interface
As of now, the message pop-up for the profiled plugin will give you this –

And the file has this –

And the Plugin Registration Tool doesn’t understand this! You’ll get this parsing error if you try –


Turn On Exception Logging
Before that, you can check this post on how you can quickly go to the classic UI’s Settings area here – D365 Quick Tip: Shortcut to Settings from the Unified Interface
To be able to capture these details in the Plugin Profile entity, enable Plug-in and custom workflow activity tracing from the System Settings as shown below

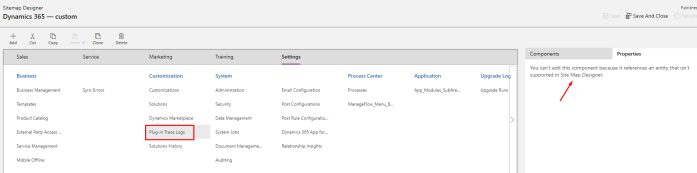
You can’t add Plug-in Trace Logs to UCI
- Smarter way would be to add the Plug-in Trace Log entity to the UCI App itself and not having to go back to the classic UI. Unfortunately, you can’t do that.
With that, we will have to go back to the Classic UI’s Settings > Plugin-In Profile Area to get out Profiled Log File.
Plug-In Trace Log
- Assuming you are back in the classic UI (maybe keep this open in another tab)
Open the Trace Log record

- Scroll down to the very bottom to find the Exception Details

- Now, copy that to the text file and attach it in the Plugin Registration Tool

- This should work and you won’t get an error

Phew! I know this is lengthy. But we hope this will soon be eased 🙂
Hope this helps you!

[…] Workaround to get Plugin Profiler from the Unified Interface in D365 CE […]
LikeLike
I believe it’s easier just to choose “Trace to Entity” option during turning on “Profiling” on the step and load profile from CRM. Check it – it’s much more easier.
Andrew
LikeLike
Yes Andrii, I realized that too. 🙂 The reason I wrote this up and I always chose Exception method is because I don’t want to let the record get created/updated in CRM. Persist To Entity will proceed with that.
LikeLike
It’s hard to argue because this is personal preference. In situation similar to this I will always choose easier way and in this case – it is usage of Entity as a storage for execution log. Andrew
LikeLike
Absolutely Andrew, even I would prefer the easier way unless someone asks me to debug on Production.
This method definitely takes way longer than its preferred.
LikeLike
I found this page when I looked for information on how to debug a plugin with the Plugin Registration Tool. Ever since we switched to UUI, I cannot debug anymore, I get an ugly System.ArgumentNullException.
Does anyone have a solution for that?
Or does anyone NOT have that problem with UI?
Any piece of information is most welcome.
LikeLike
Hi Urs, sorry to hear that – maybe you can try this? – https://rajeevpentyala.com/tag/persist-to-entity/
Persist to Entity method above is easier than what I suggested. Hope this helps you.
LikeLike