Update SVG Icon to Custom Entity in Sitemap | Model Driven Apps

So, if you are used to updating Icons to entities in the classic UI, here’s what you need to do in order to update the SVG image of a Custom Entity you just created using new Power Apps Maker portal.

Let’s see below is you custom entity and it comes with its default icon which you want to set to a custom SVG icon.

Adding SVG Icon to Custom Entity

Given that you have appropriate access to the be able to Customize the system, follow the below steps –

  1. In your solution, you have the table as well as the SVG Icon you just created the Web Resource for and uploaded an image which you want to set as Icon.

  2. Now, select the Table you want to set the SVG icon to, and click on Properties.
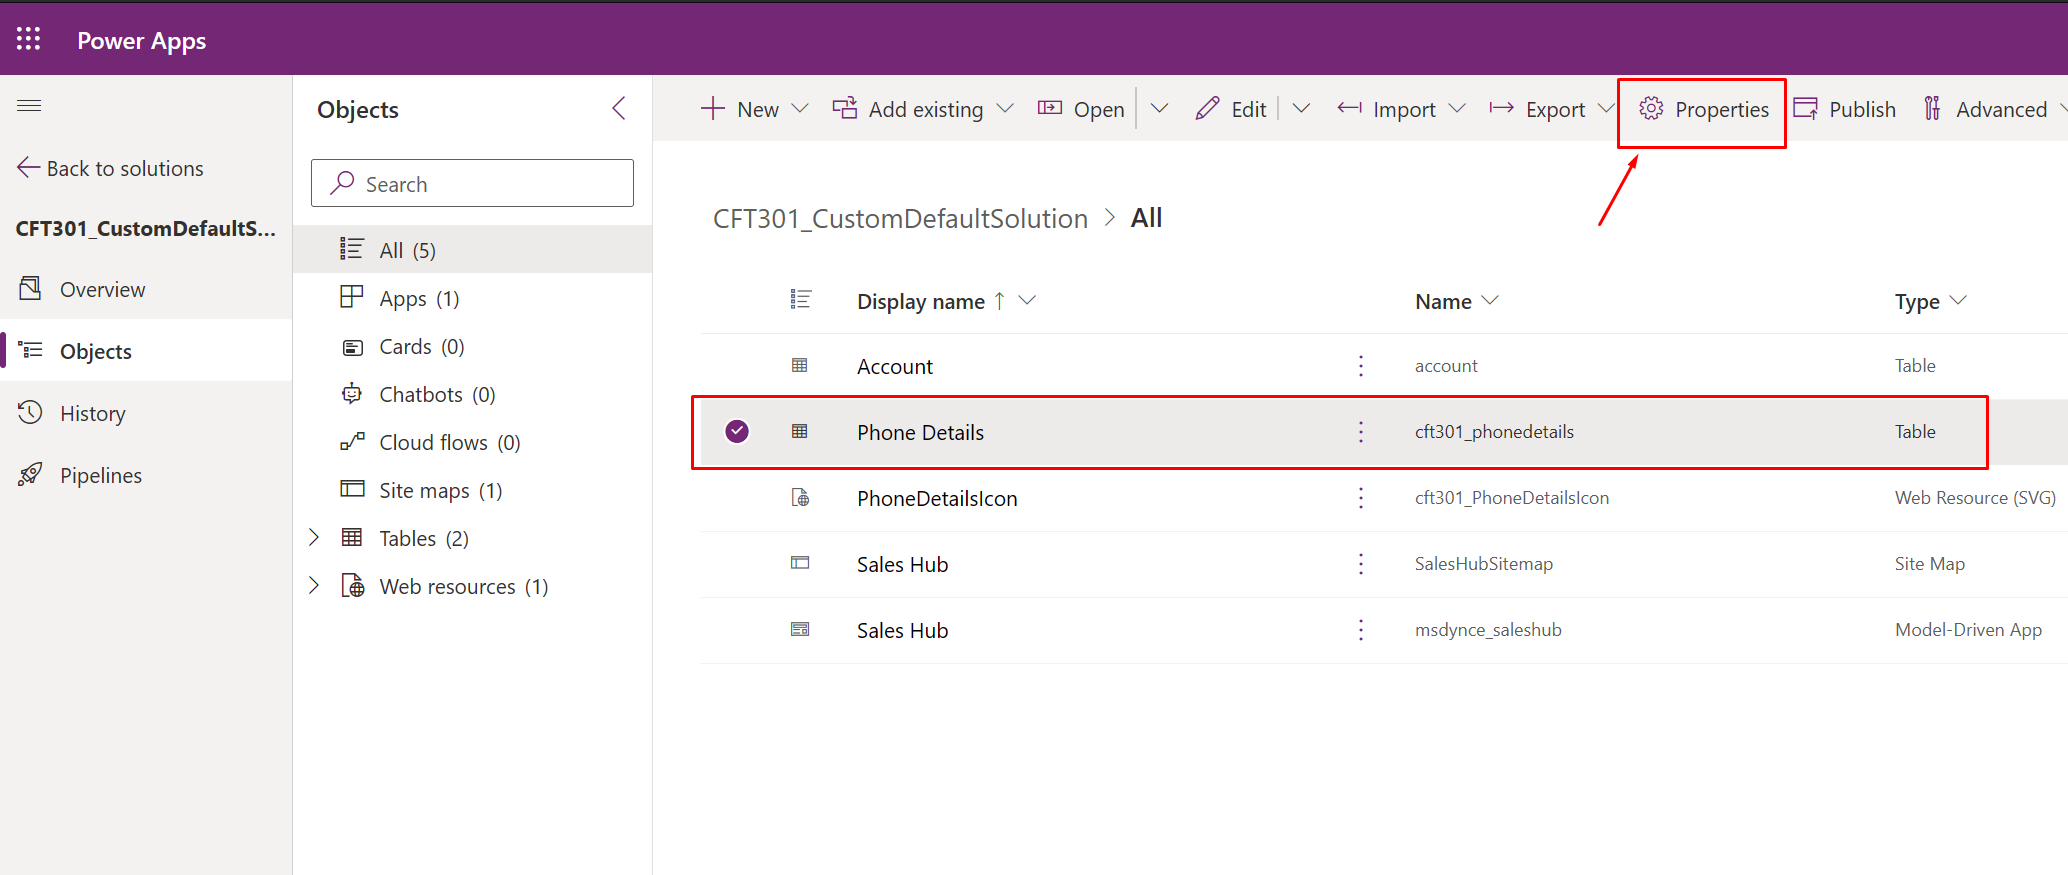
  3. On the right hand pane, expand the Advanced area and look for the Choose table image field.
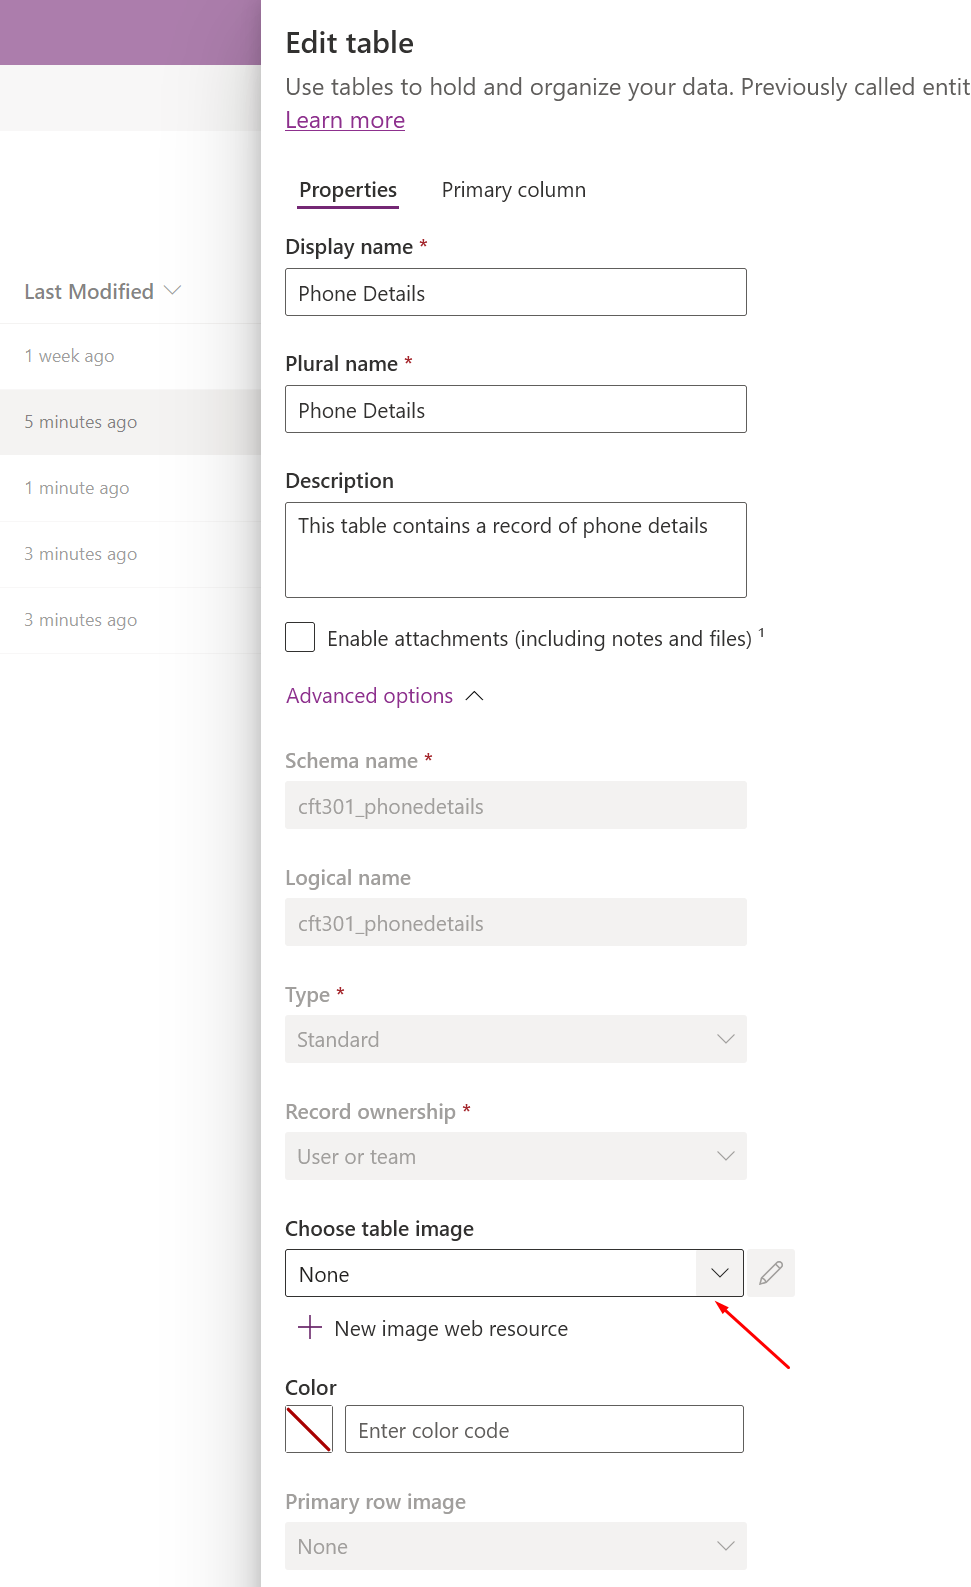

  4. Then, start typing the Display Name of the SVG icon which you wish to set to this Entity.


    Click Save if no other changes are to be done.

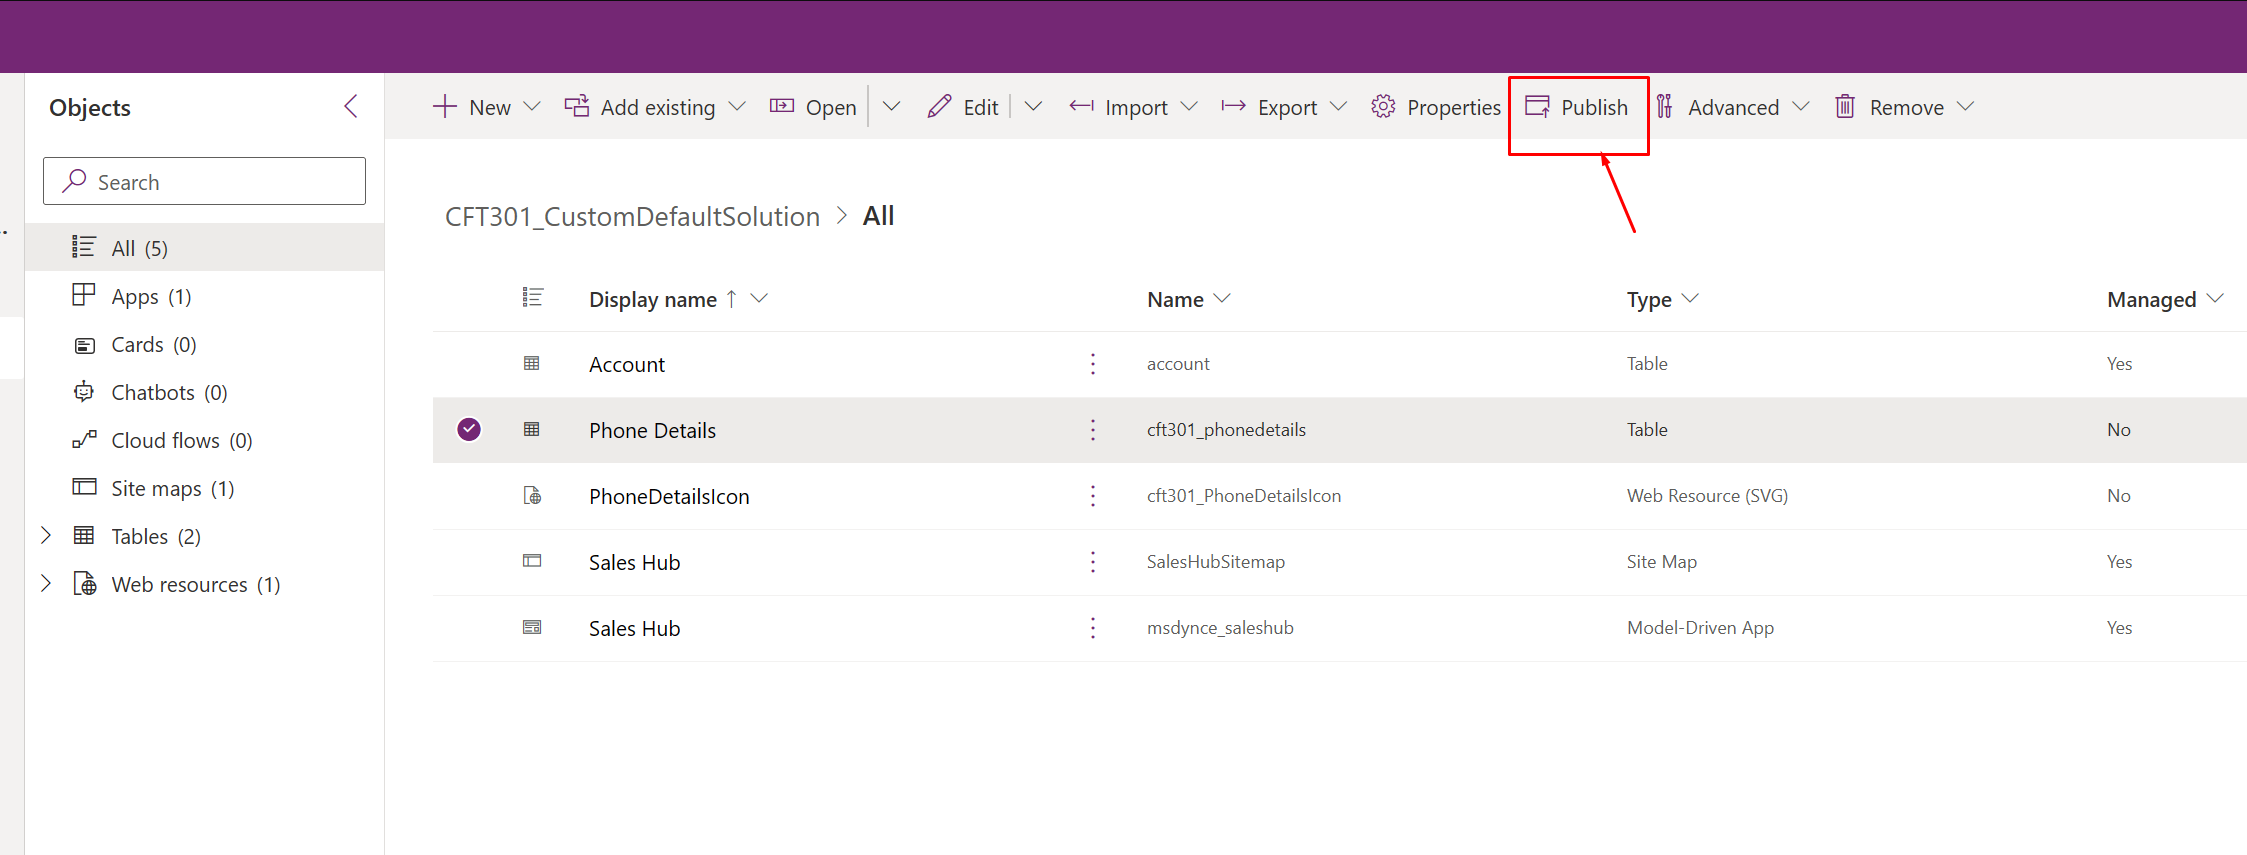
  5. Once Saved, click on Publish.

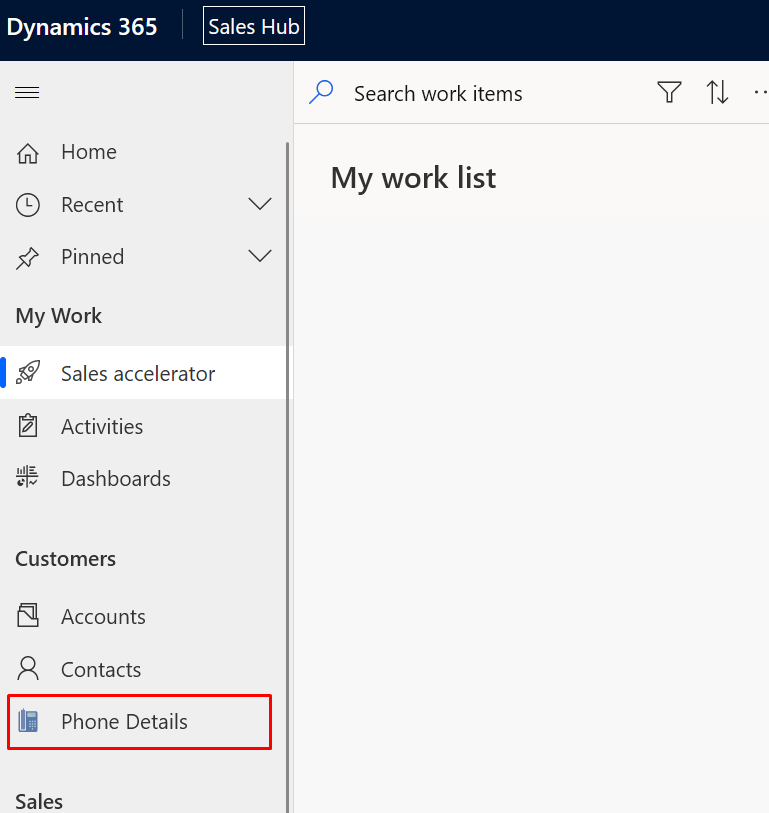
  6. Now, when you refresh the App where the custom entity is listed in the Sitemap, you’ll see the icon updated.
Hope this was useful!

Thank you!

Preferred Solution in Dataverse | Power Platform Admin Center

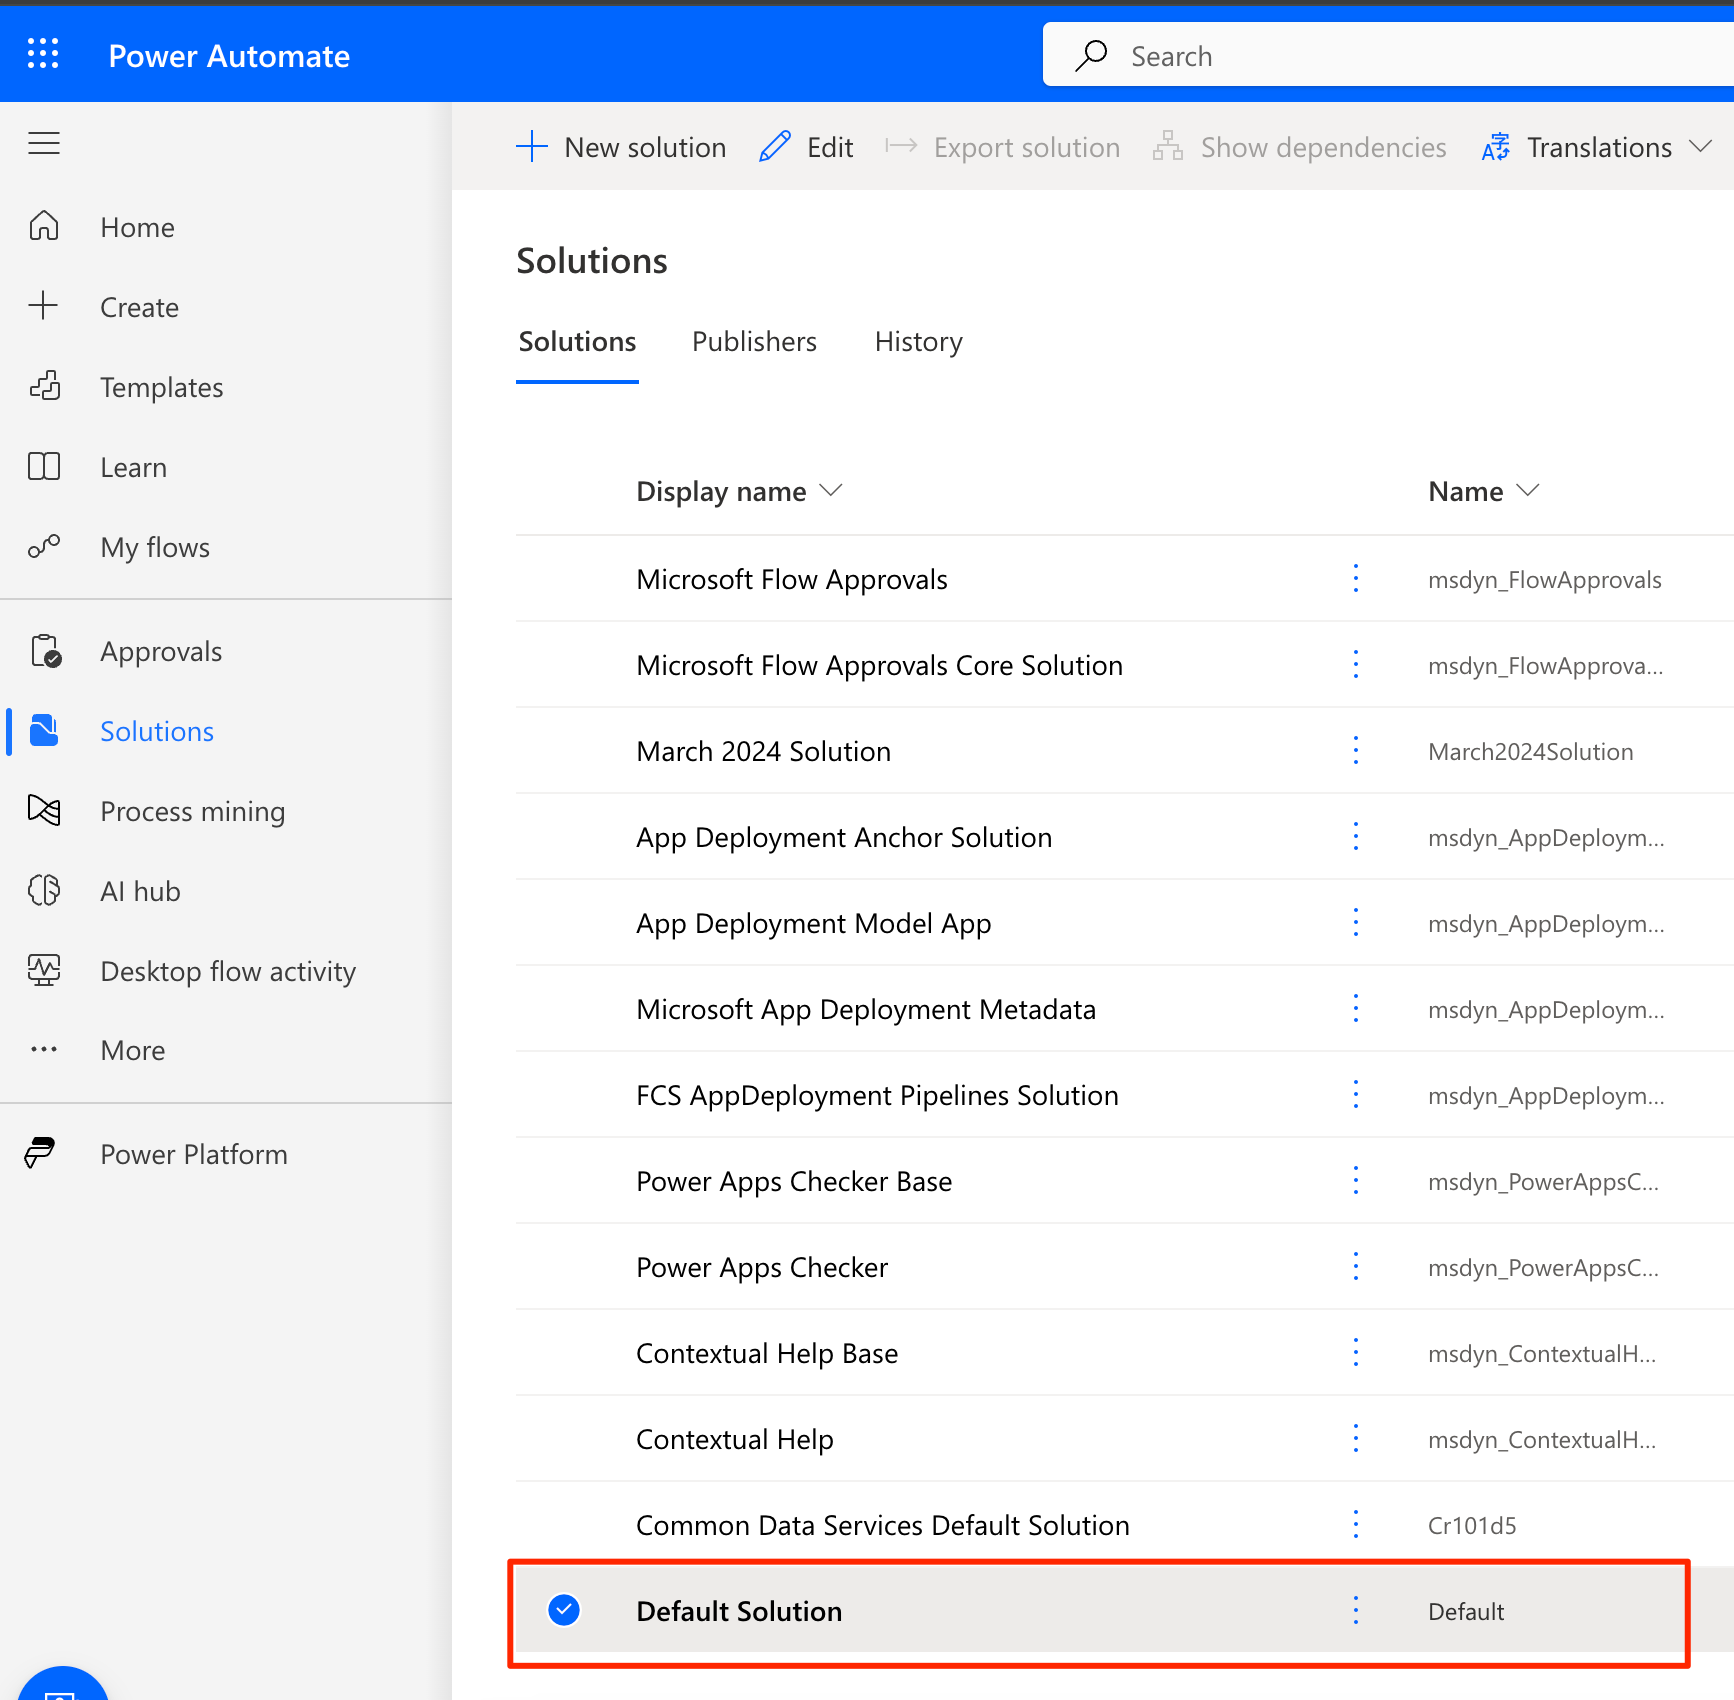
By default, everything goes inside a Default Solution if you are aware of the classic way of doing Customization in Dynamics 365 CRM. And this causes components to be lost in Default solution without knowing who created where and what was that.

Hence, to be able to collect all the components created outside of Solutions, Preferred Solution is a great way to automatically add components created outside Solution in a single solution to ensure accountability.

Let’s see how this works with help of this simple post!

Mark a Preferred Solution

Given you have appropriate rights like System Administrator or System Customizer, you can go to the Maker Portal (https://make.powerapps.com/), and follow the steps below –

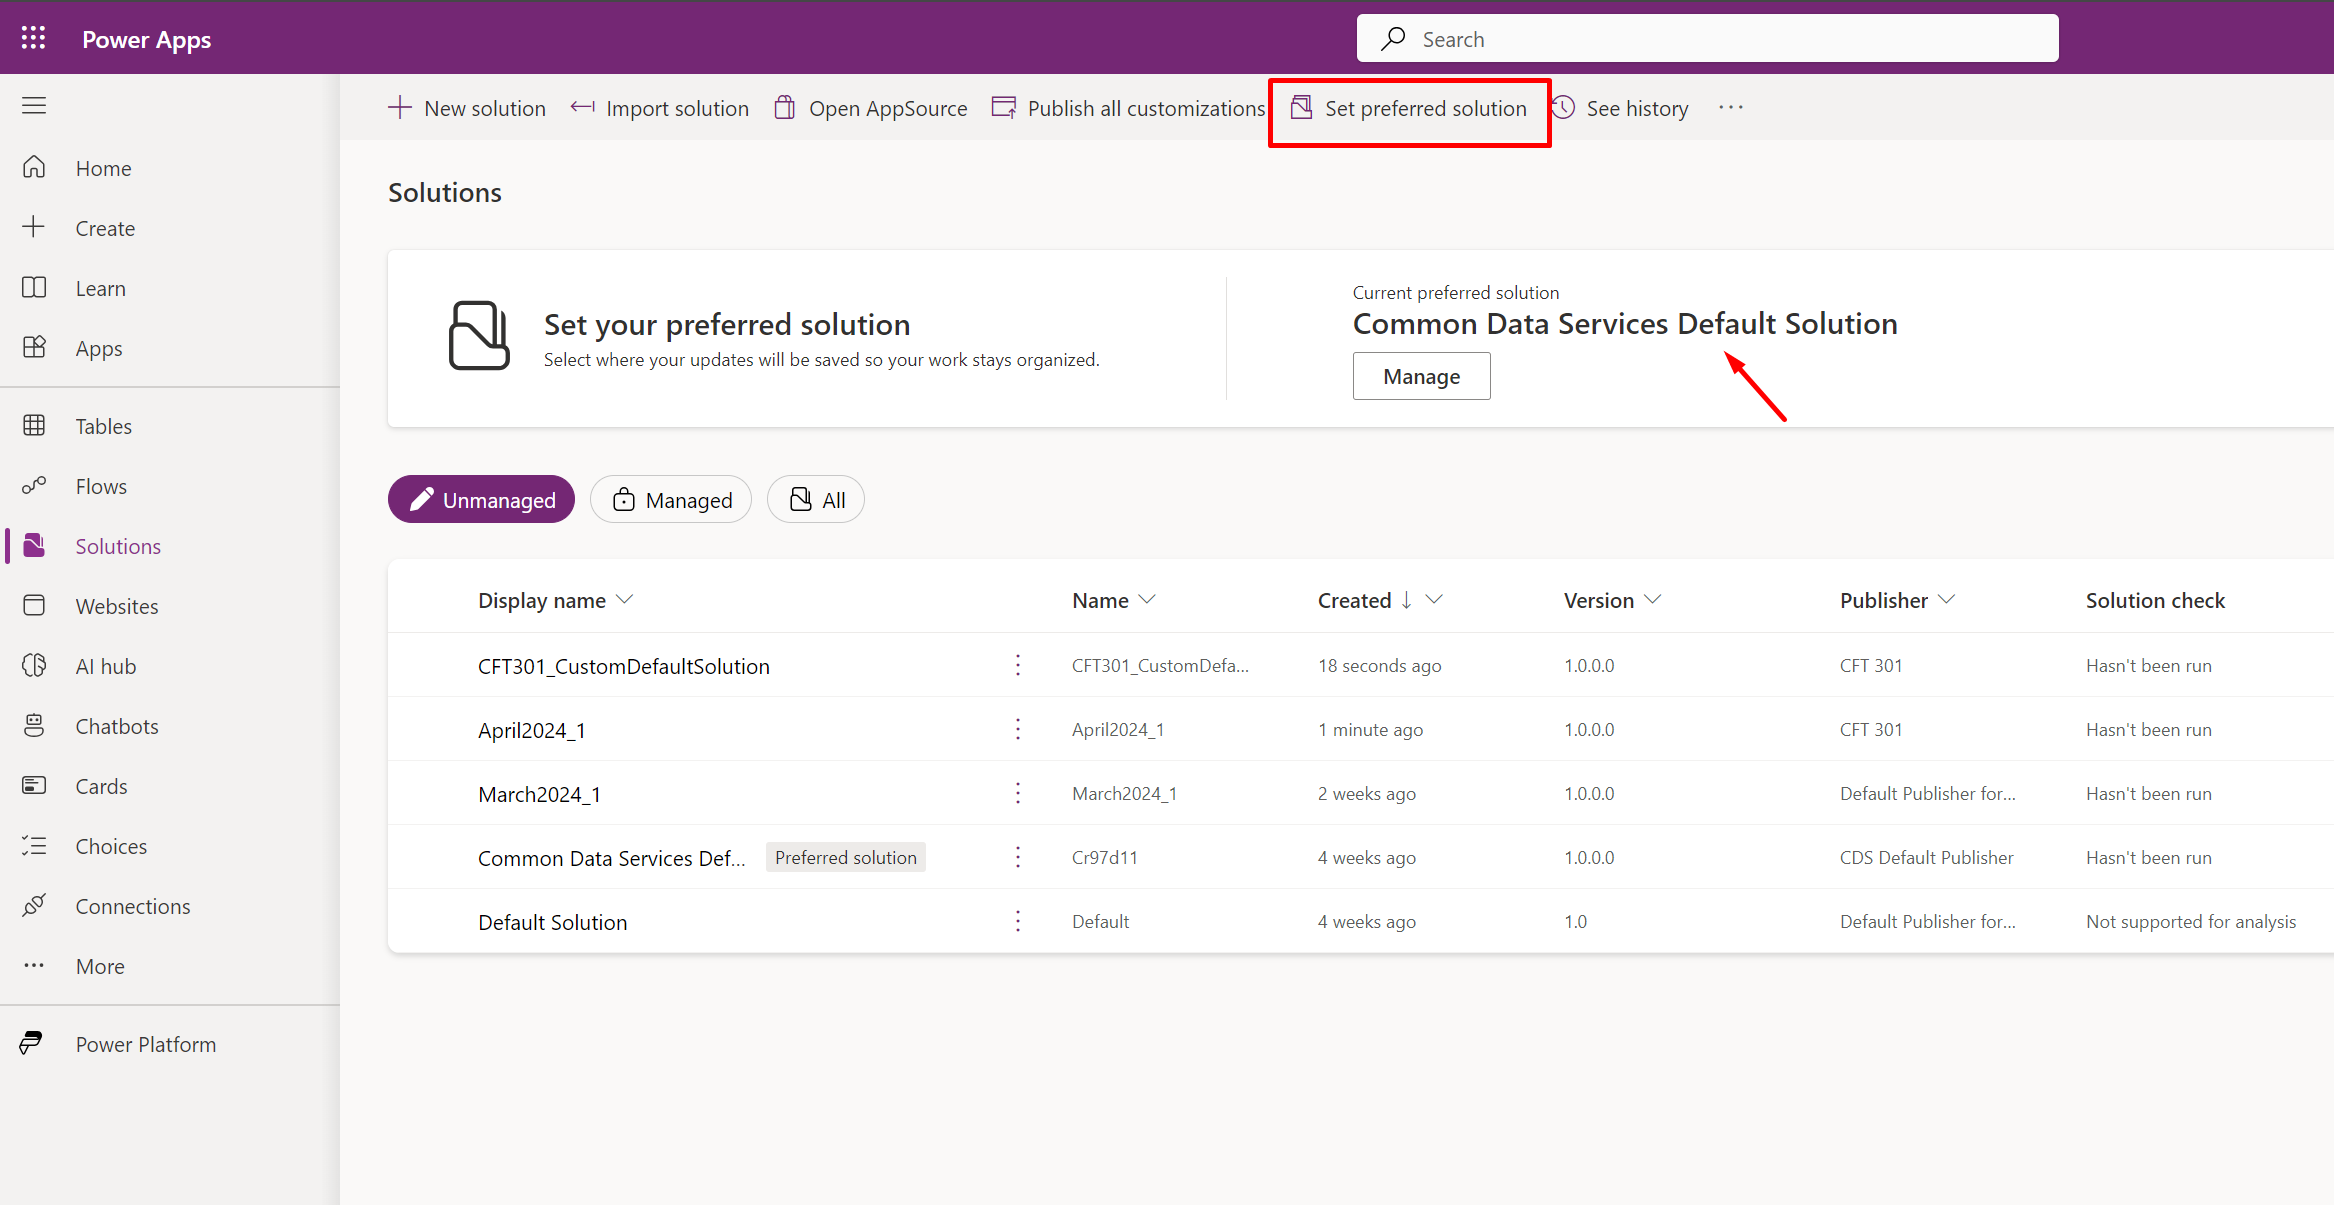
  1. In the Power Apps Maker Portal, when you navigate to Solutions – you’ll see a message saying ‘Set your preferred solution’ and on the right hand-side show that the Common Data Services Default Solution is already preferred [You’ll know this from Customizations option in classic UI].

    And on the top, you’ll see button to Set preferred solution.


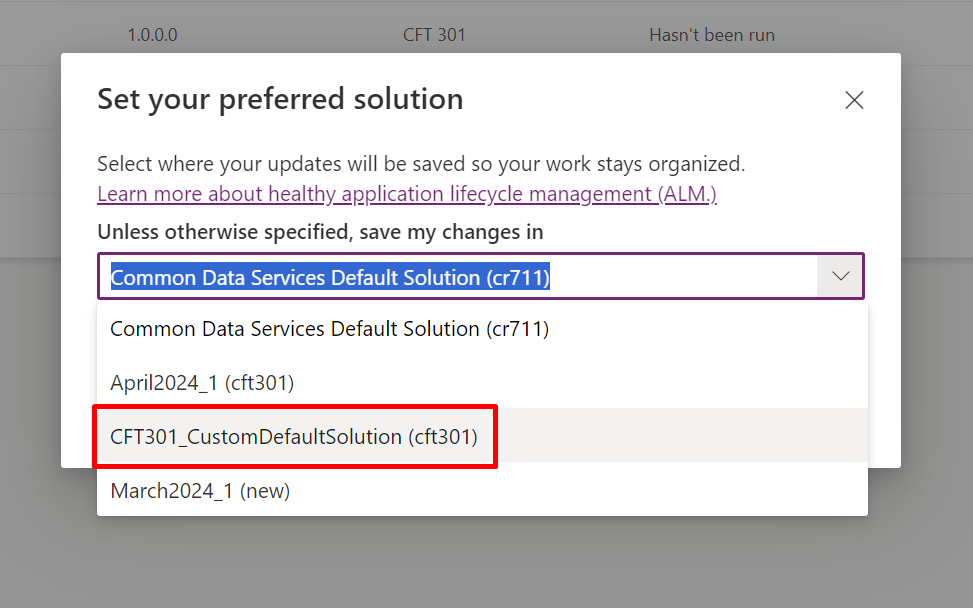
  2. Now, when you select to set preferred solution, you’ll see all the unmanaged solutions you have.
    Select the one you want to mark as Preferred for anything not directly added to a solution.

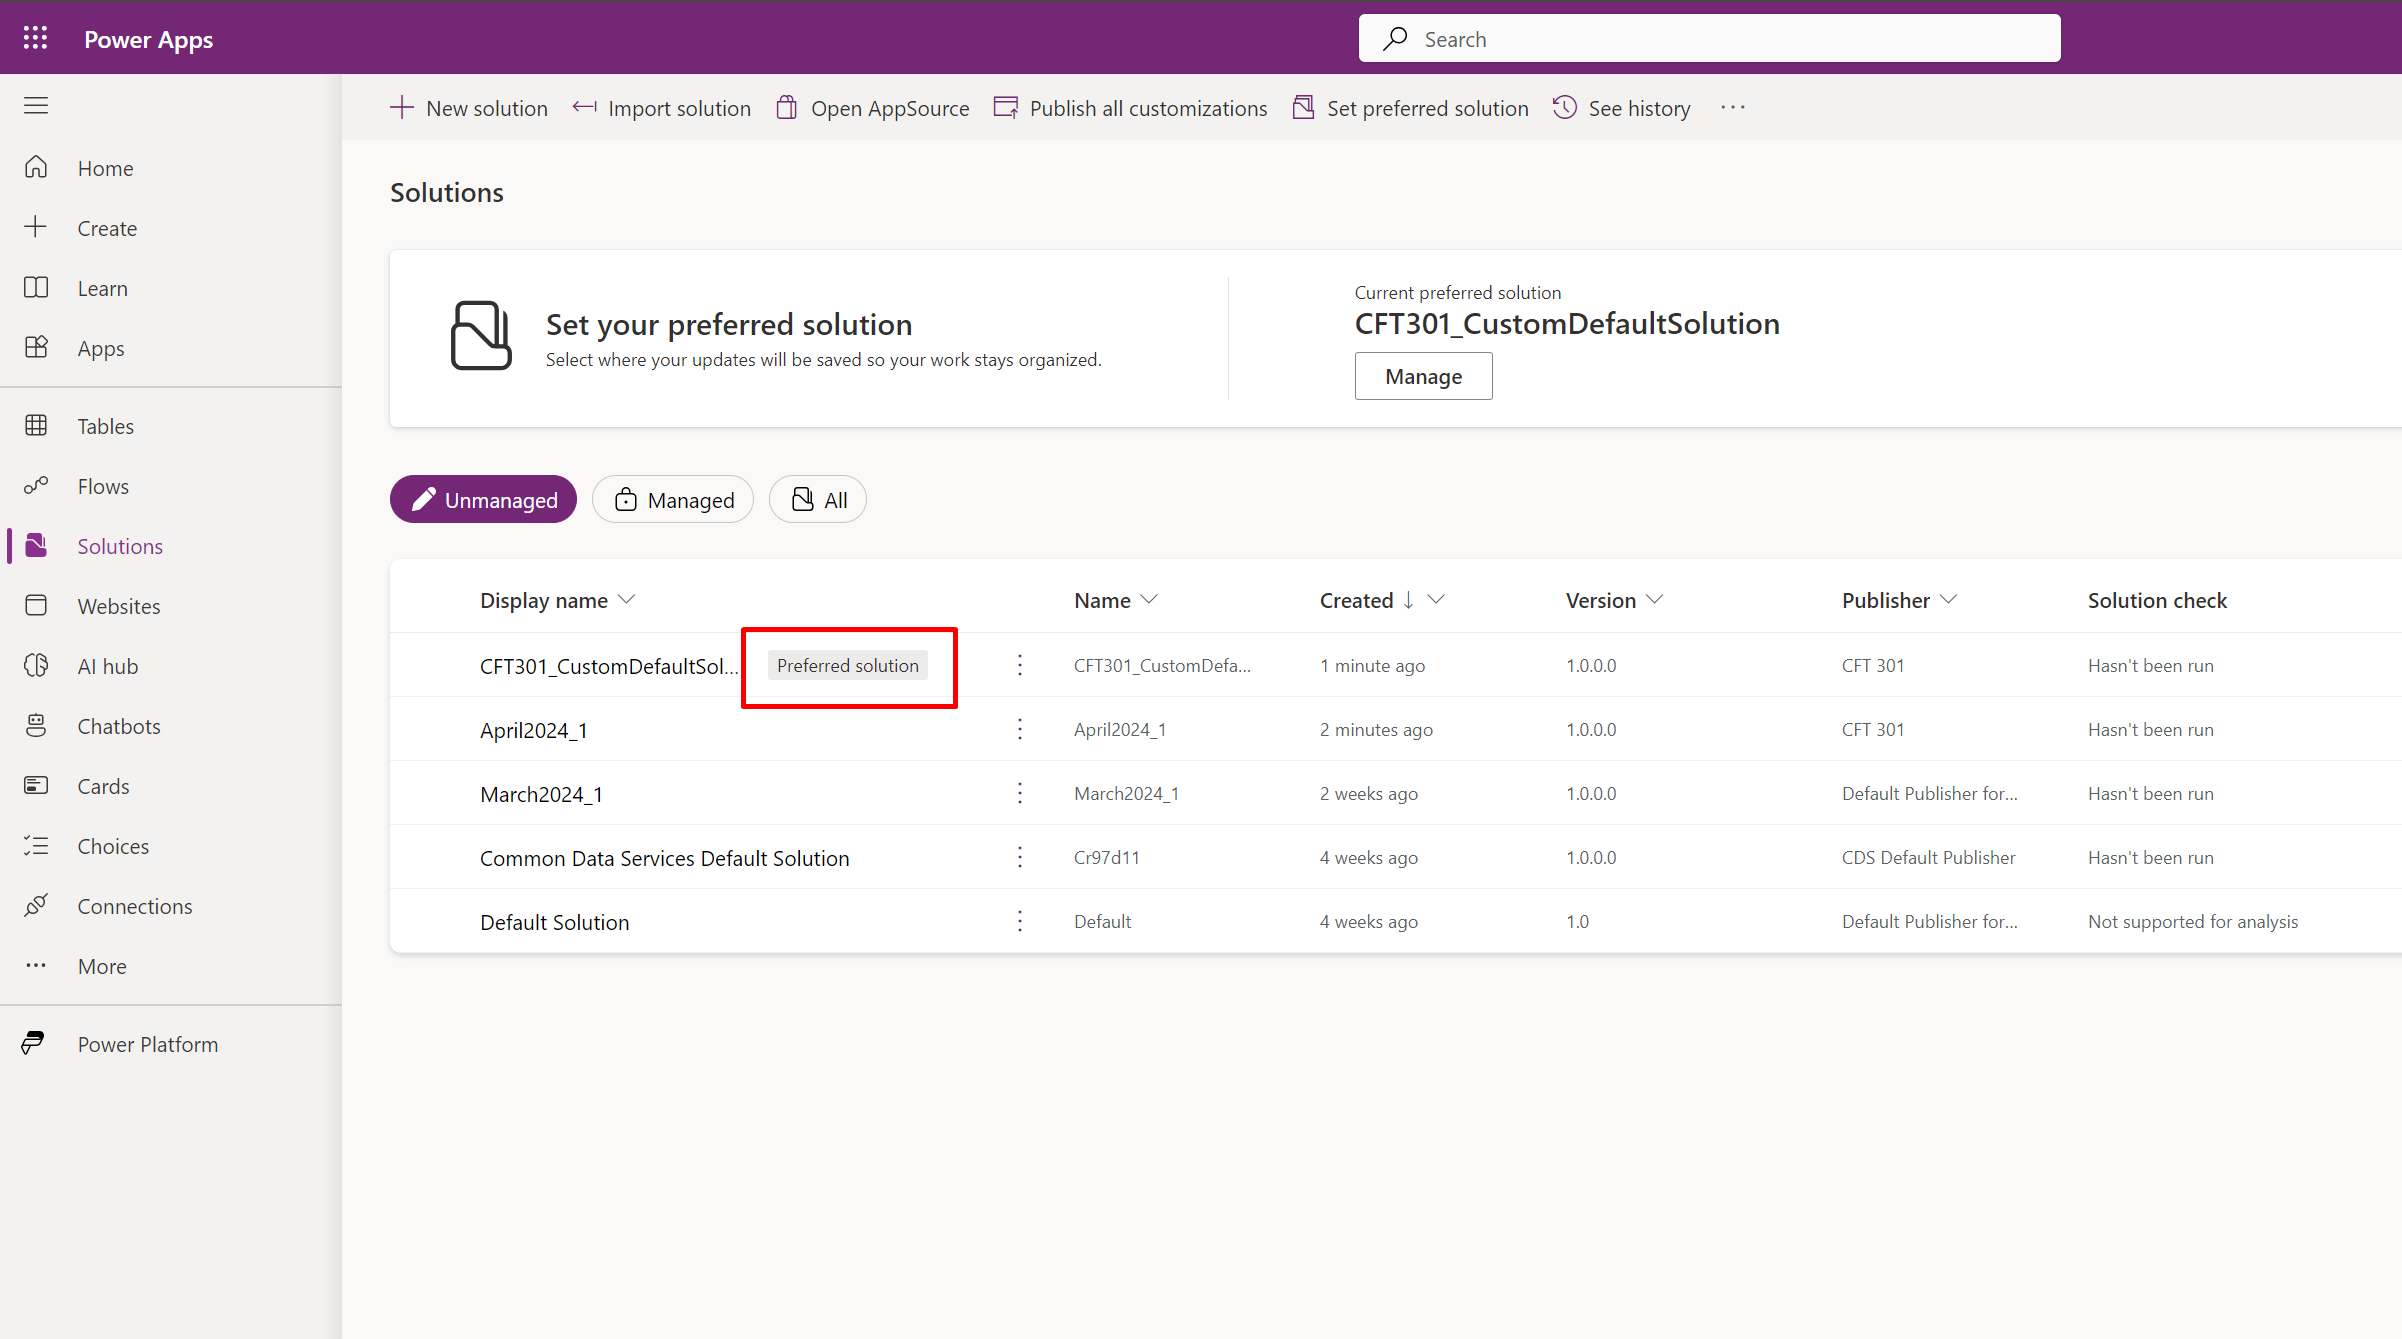
  3. Then, you’ll see that Preferred Solution label has been applied for that Solution.

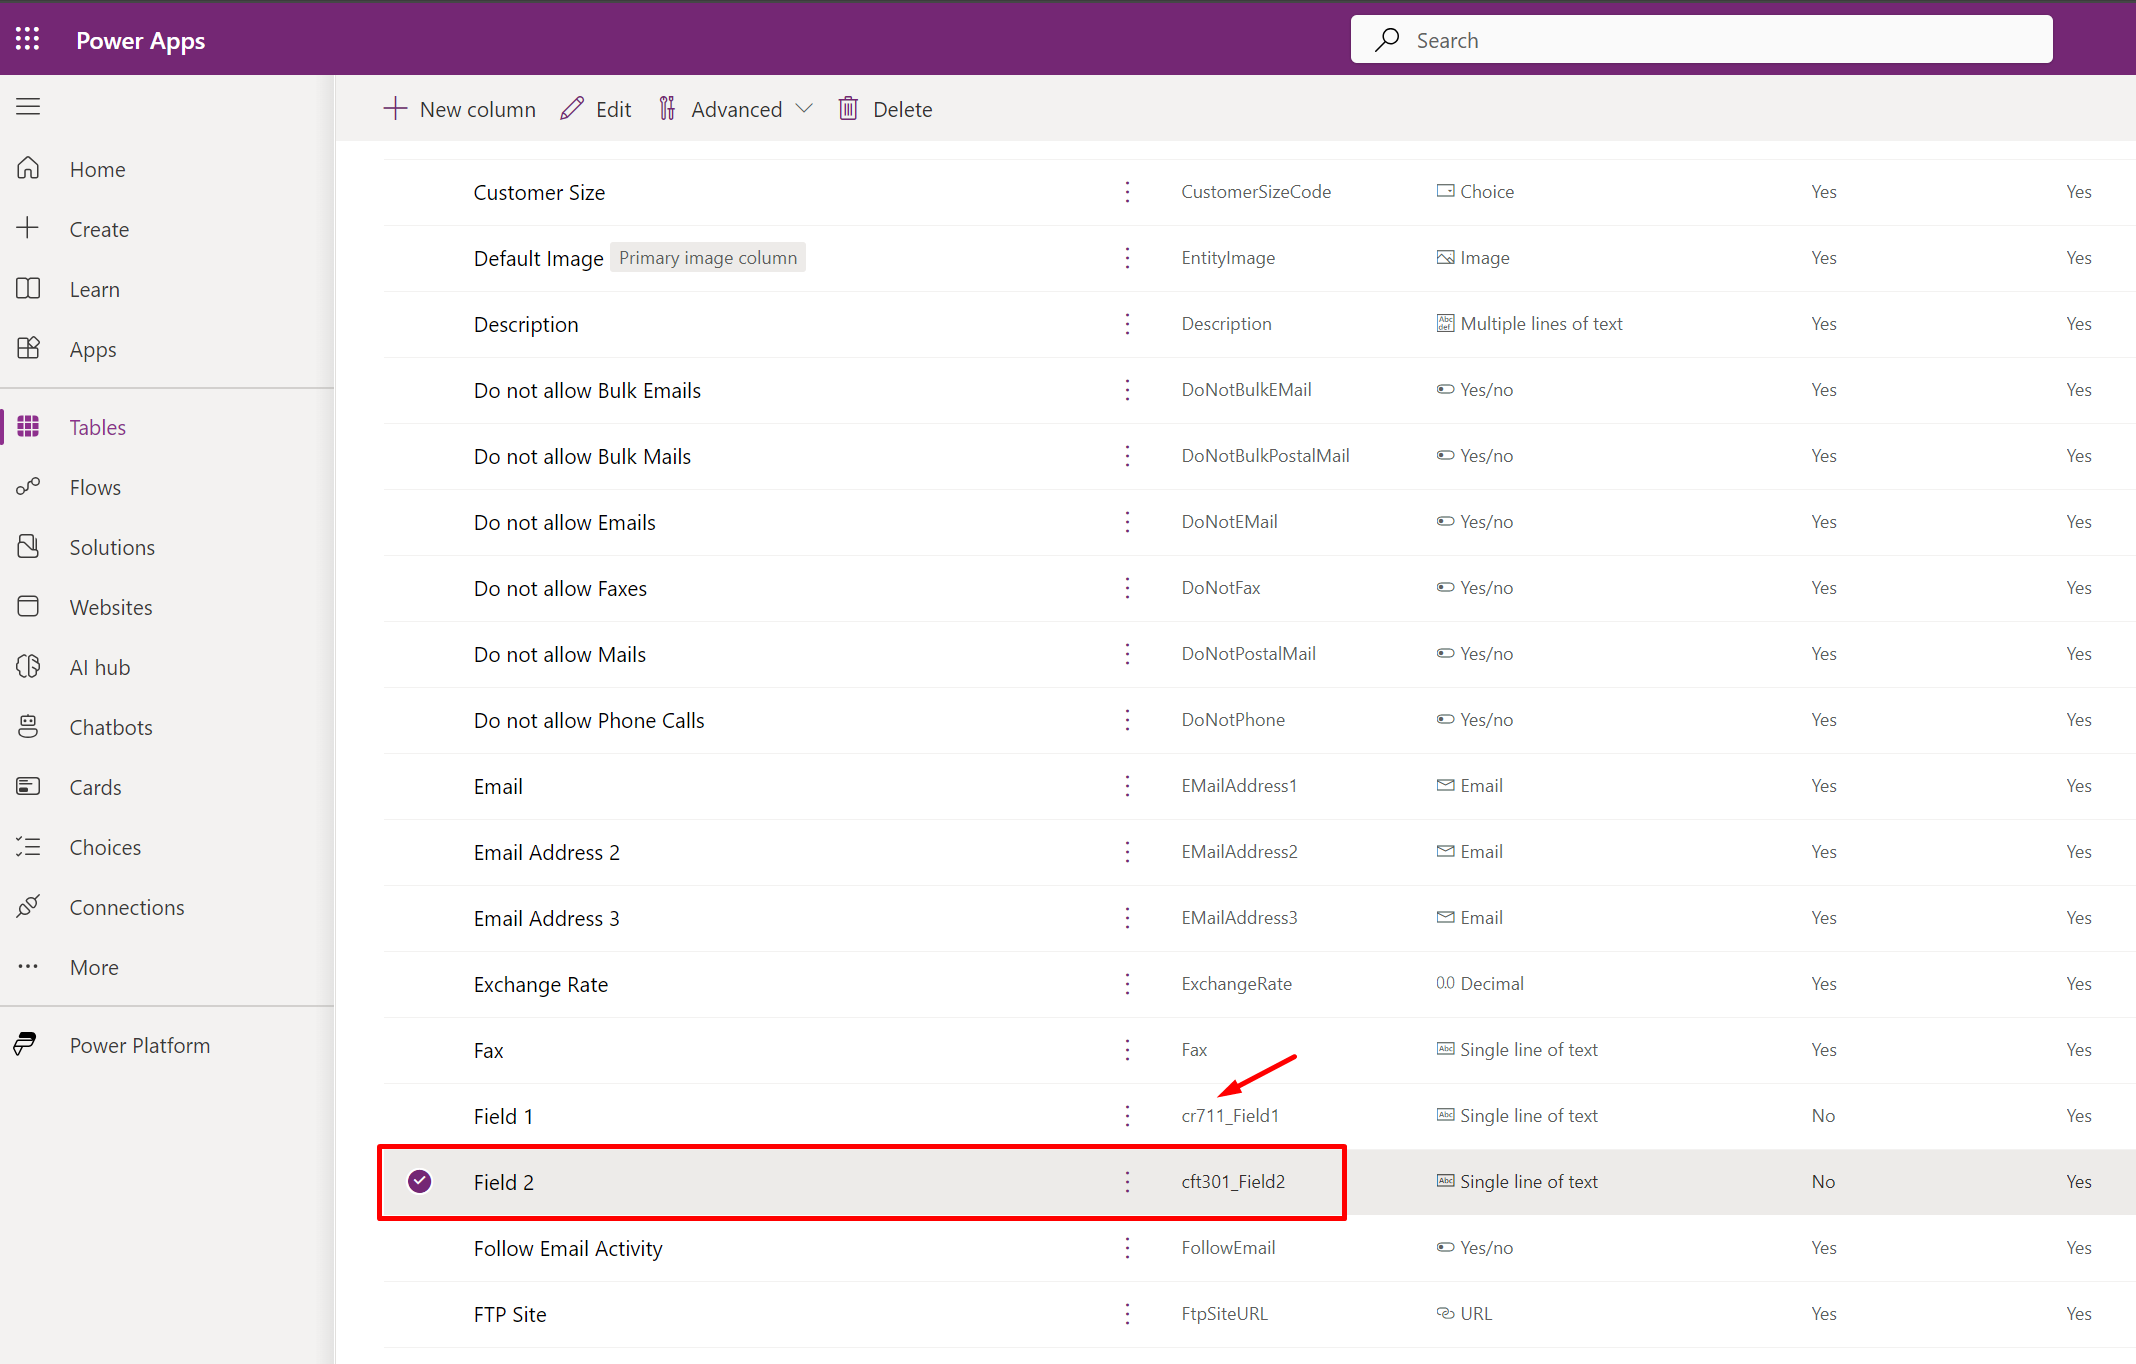
  4. Now, even if you add anything directly from other areas like Tables and add a field (for example), it’ll end up having the Prefix of the Solution itself.


  5. In this example, it’s add Field 2. The Prefix set for the Preferred Solution was “cf301

  6. And when you open the Preferred Solution itself, the component you created outside the solution will be added to the Preferred Solution automatically.


  7. This way, it’s easy to not lose any customization in Default Solution and makes it easy for all the components which were created outside of the solution to be gathered in place when you want to investigate your environment!

Hope this was useful!

Thank you!

Use Monitor to debug Model-driven apps remotely | Power Platform

Monitor is one feature that comes in super handy when end-users complain about an issue which is difficult to ask end users to send across logs from the browser.

And here’s where Monitor comes in handy!
Let’s see how this works through this simple blog post!!

Capture events from Monitor in Model Driven Apps

Here’s how you can Monitor in Model-driven apps’ Monitor to capture issues on an End User

  1. You can go to Power Apps Maker Portal (https://make.powerapps.com/) and make sure you are switched to the intended environment.
  2. Then, select Apps on the left hand pane and expose all the Apps. Select the Model-Driven app you want to enable Monitor for. Once you select, you can then drop down from Details flyout menu and click on Monitor.

  3. Once you click on Monitor, it opens the Monitor application itself where all the logs you work on will be captured. And you can also notice that there’s a Play model-driven app button as well to enter in Debug mode.


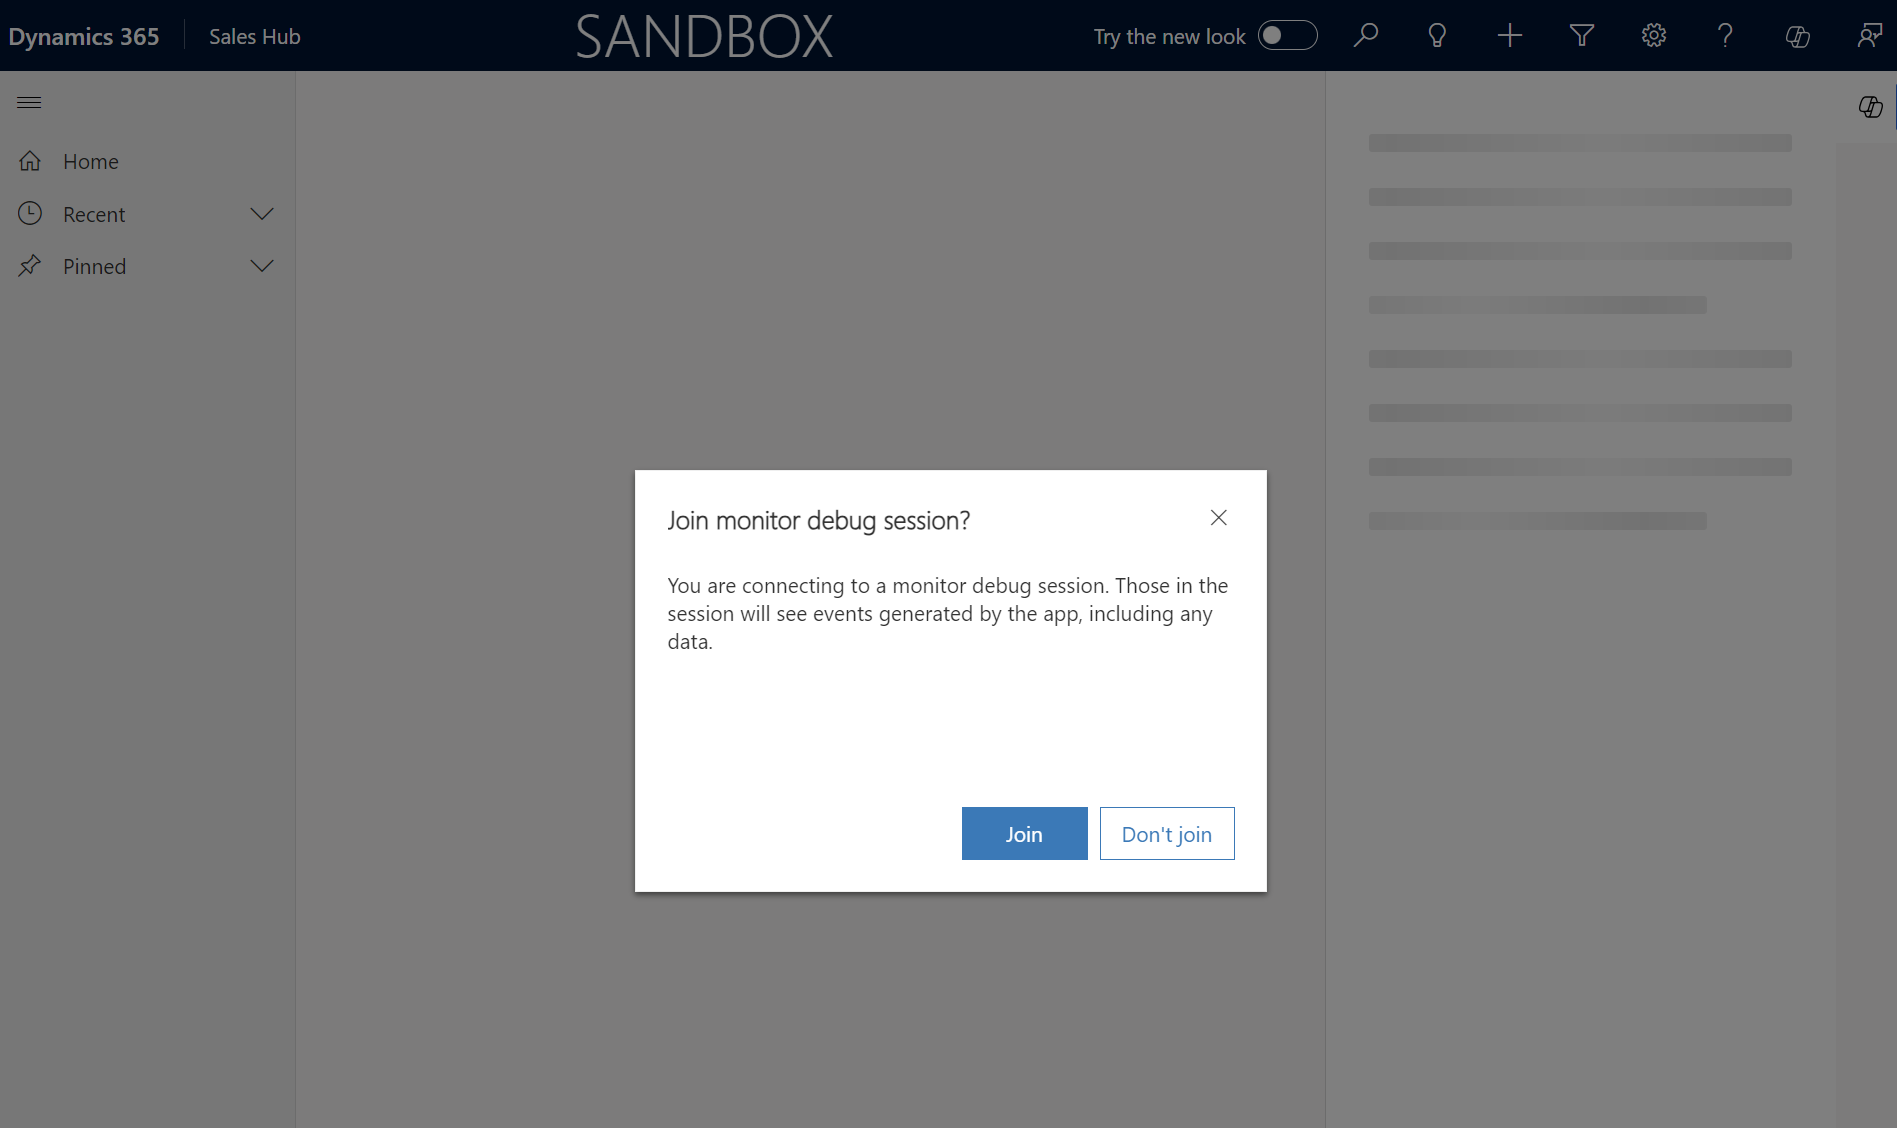
  4. It opens the Model-driven app in a new tab and asks you to confirm if you want to join the debug session.

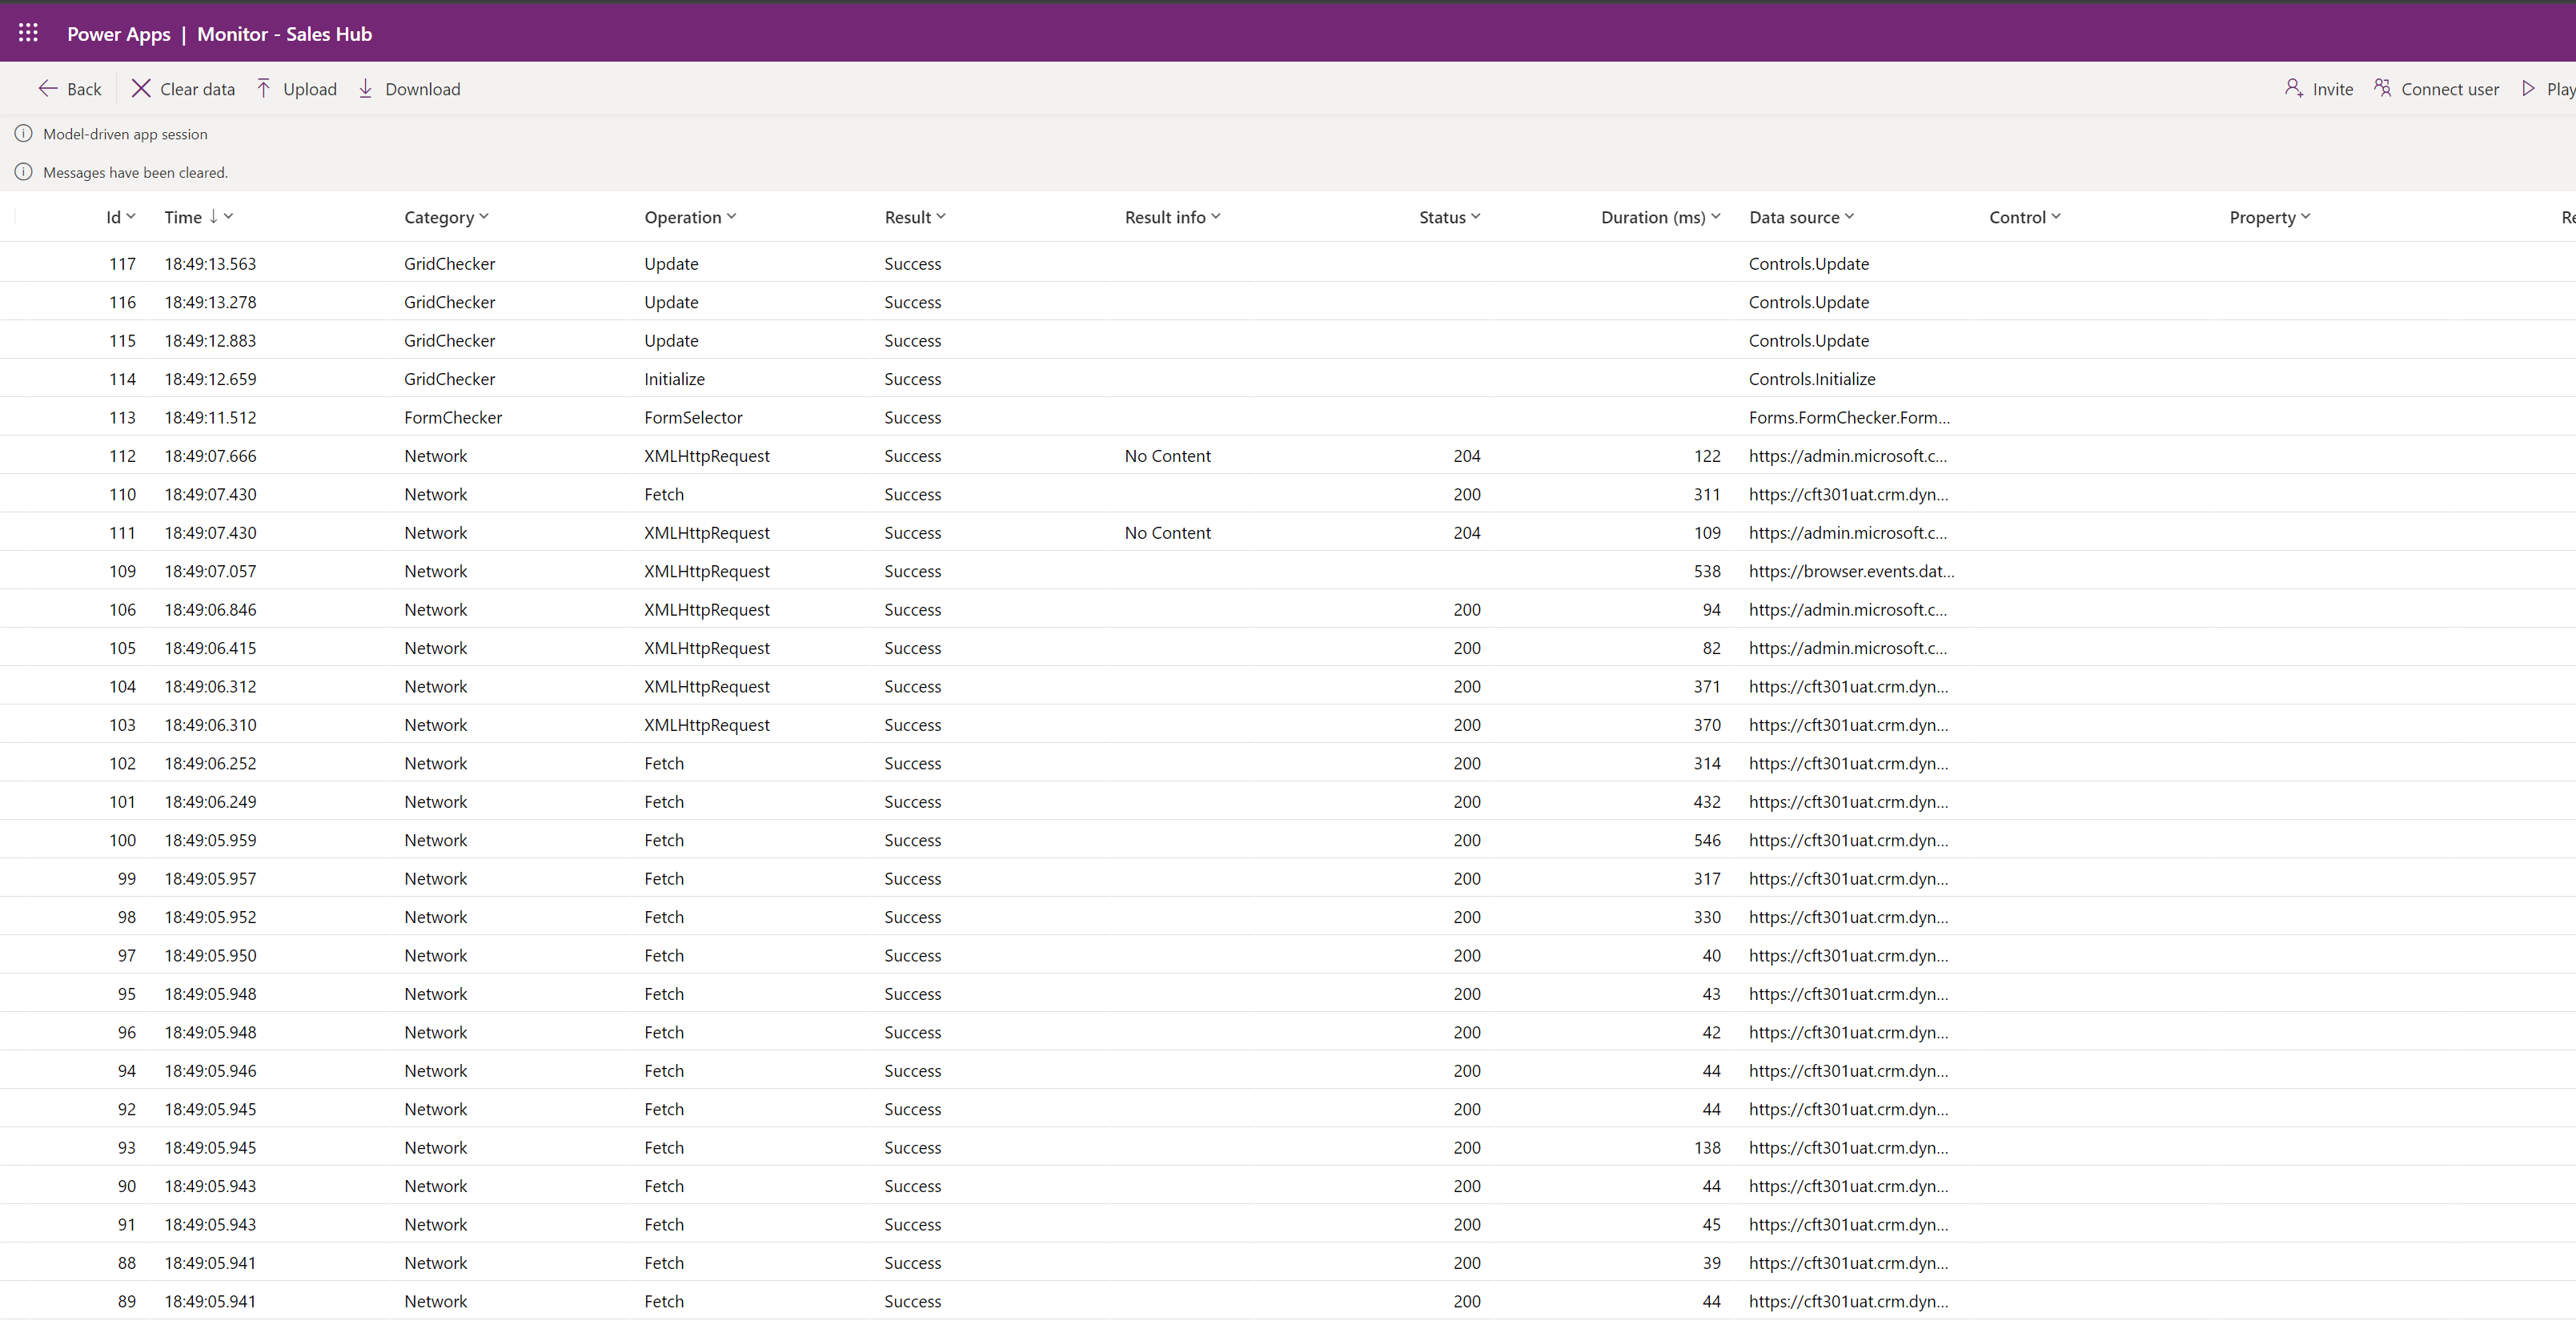
  5. Once you click on Join, it’ll run the app in debug mode and you can see the Monitor tab and notice that it has started capturing the logs based on your operations in the Model-driven app session you are running in parallel.


  6. And when you go about working in the model-driven app, it’ll keep capturing the traffic just like on a browser’s Network in Dev Tools

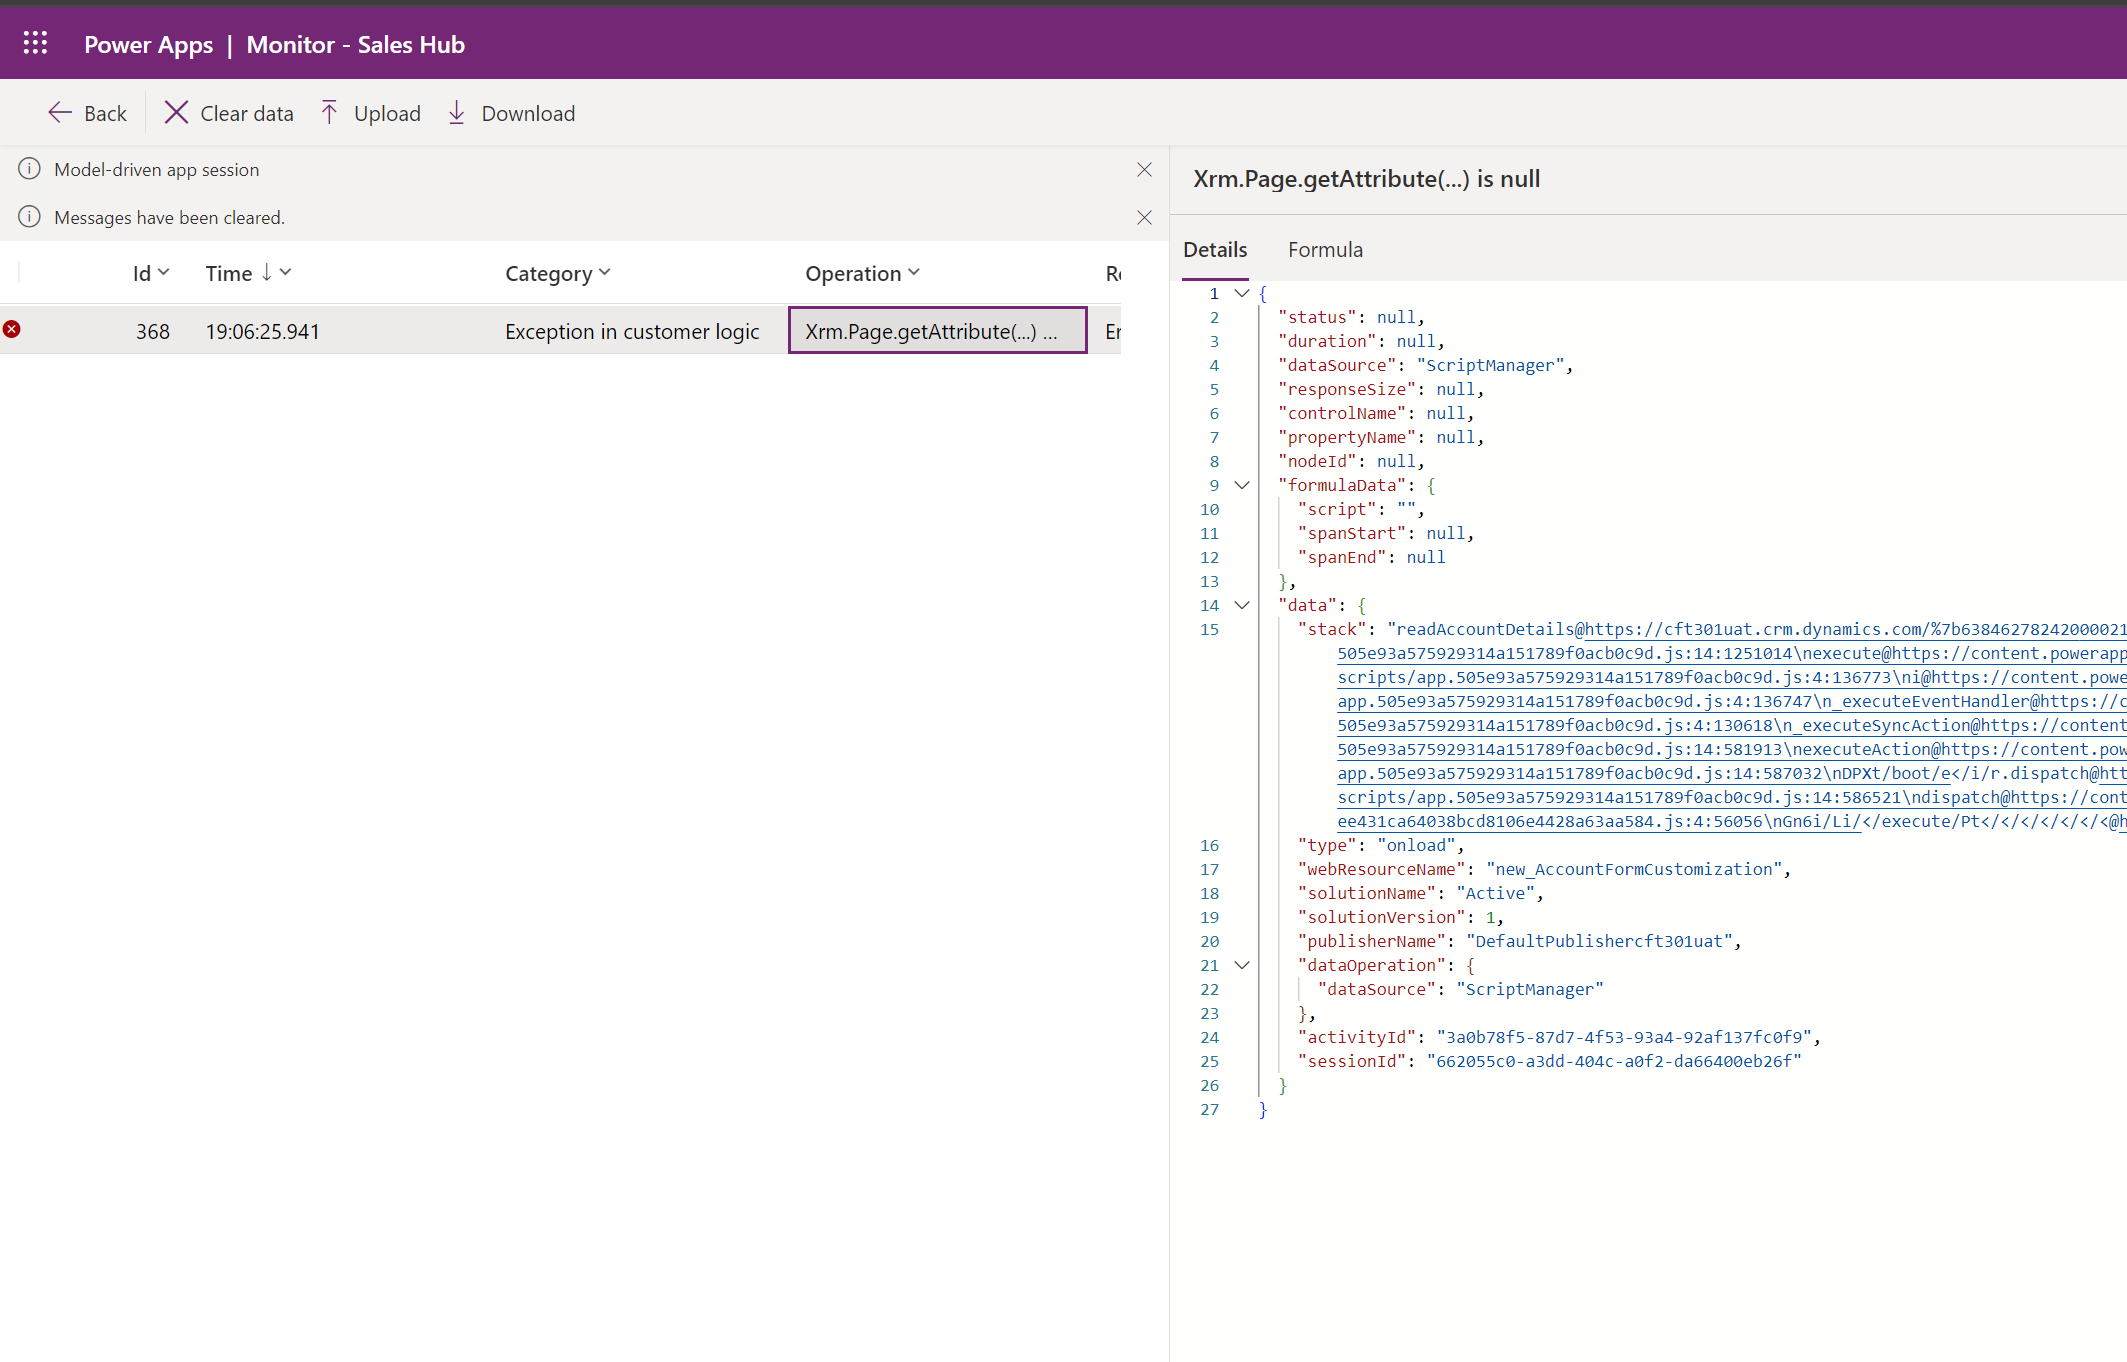
  7. Now I deliberately added an erroneous code in my custom JS so that I could capture an exception in the monitor.

  8. And if you look at the monitor, you’ll see that this has been captured.

  9. And this is the wrong script I entered so that my code wouldn’t find the incorrect field name and throw an error when I try to retrieve value from an attribute that doesn’t exist (without null checking if the attribute exists or not)

  10. However, best use case is when you ask end-users to join your session. Let’s see in the next session on how you can achieve this.

Invite Users to your Debug session

In the Model-driven apps monitor, here’s how you can invite other users to join your session –

  1. In the Monitor, you’ll see Invite or Connect to a User. For this example, I’ll choose Connect user option.

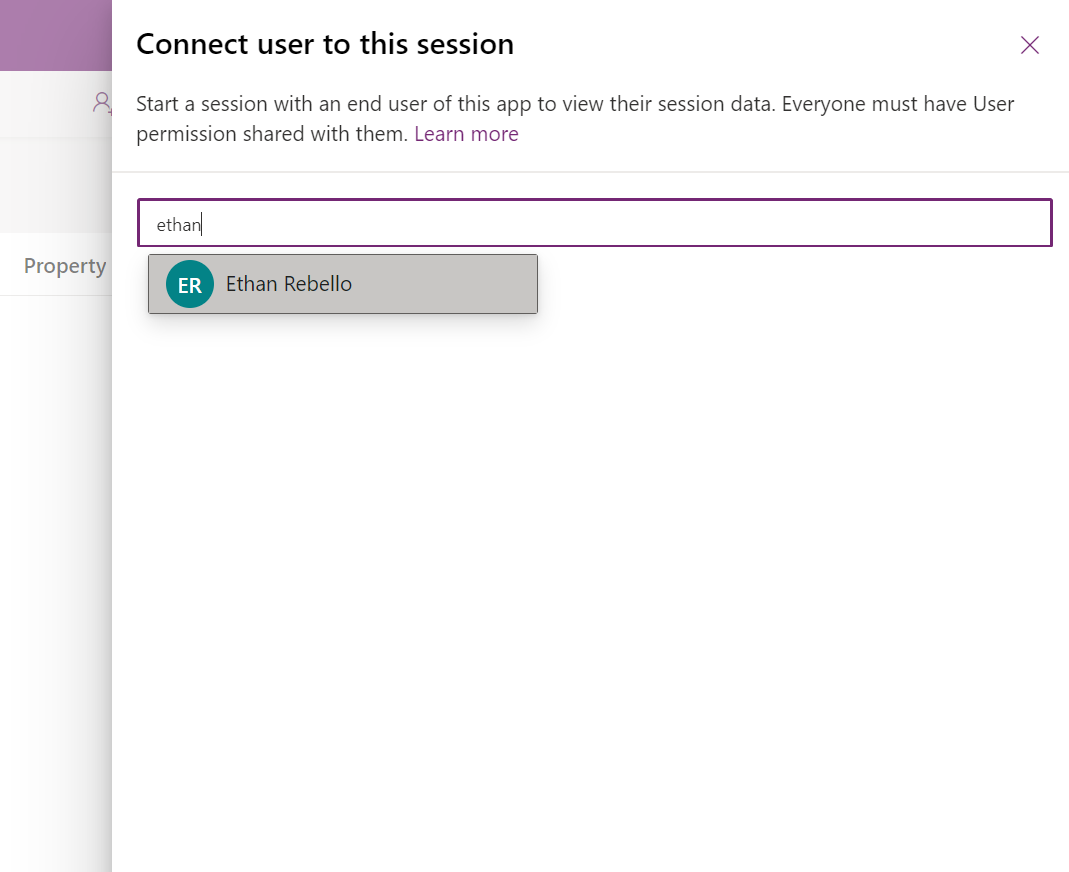
  2. Then, I can simply search for the User whom I want to generate a join link for.

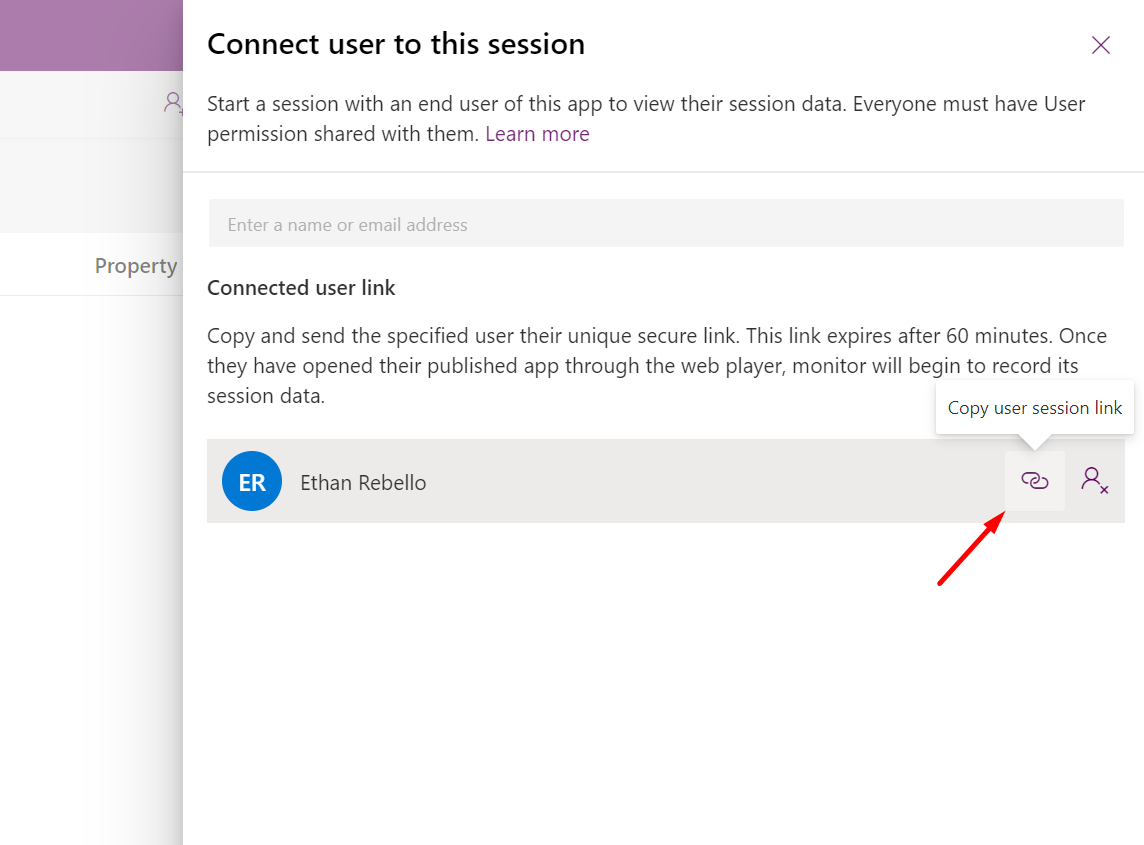
  3. Now, once this user is added, you’ll see a copy link option to copy the link and pass it on to the user who needs to join.

  4. Once the end user has this link, then can join the session and they’ll see this message on their Dynamics model-driven app

  5. And similarly, once they start reproducing the issue, you can start capturing the traffic on your end.


Hope this was useful! In order to fully understand the capabilities of Monitor for model-driven apps, here’s Microsoft’s official documentation – https://learn.microsoft.com/en-us/power-apps/maker/monitor-collaborative-debugging?WT.mc_id=DX-MVP-5003911

Hope this was useful!

Thank you!
Why Environment Variables don’t appear in Flows? | [Quick Tip]

At times, if you are new to working with Environment Variables and you’re looking to use them in your Flows but don’t see them?

Here’s why!

Flows Outside Solutions

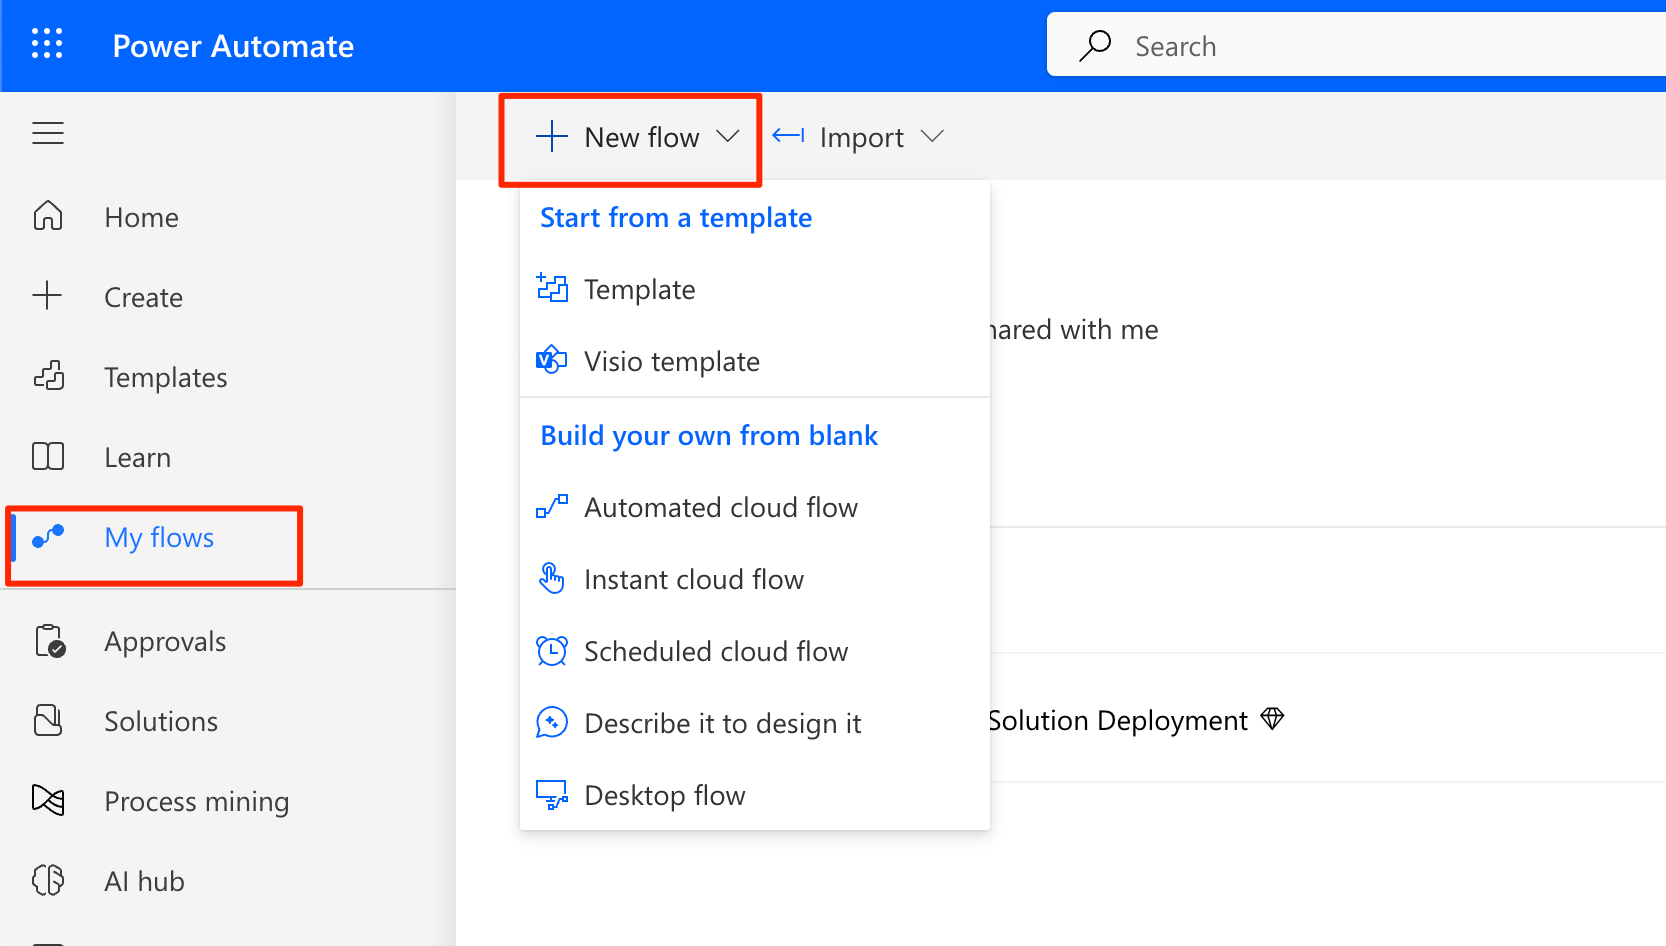
If you are creating Flows from the My Flows section, let’s see if you can access Environment Variables or not –

  1. If you use My Flows way to create your Flows as shown below –

  2. You won’t be able to access Environment Variables in that Flow

Flows in Solutions [Default and other Solutions]

So, you’ll need to have your Flows inside a Solution – even if you are creating a Flow in Default Solution, you’ll be able to access Environment Variables from another solution –

  1. If you are in a Default Solution as shown below and you create a Flow there, you’ll be able to access Environment Variables.


  2. And you create a Flow there, you’ll be able to access Environment Variables.

Hope this was useful!

Thank you!

Pre-Export Step Required setting in Deployment Pipeline | Power Platform Pipelines

Now that you must’ve already setup your basic Power Platform Pipeline as yet and are looking to explore how to extend the Power Platform Pipeline to do more advanced operations, this post is for you!
In case you are still looking to first setup your Power Platform Pipeline, you can check this Blog Series which this very post too, is a part of – Power Platform Pipelines | Blog Series

What is Pre-Export Step Required Setting?

This is the ability to have a trigger before an Export operation from the Development Environment is initiated in order to run the pipeline – only available for the first stage in the pipeline.

This is provided so that you may want to run some external operations before this is taken through the pipeline for deployment.

Use Case is – that you want to first seek an approval from the Admin before the Solution is deployed to Production (or rather, sent through the pipeline for deployment). Once approved, the pipeline should automatically proceed towards executing the rest of the deployment stages.

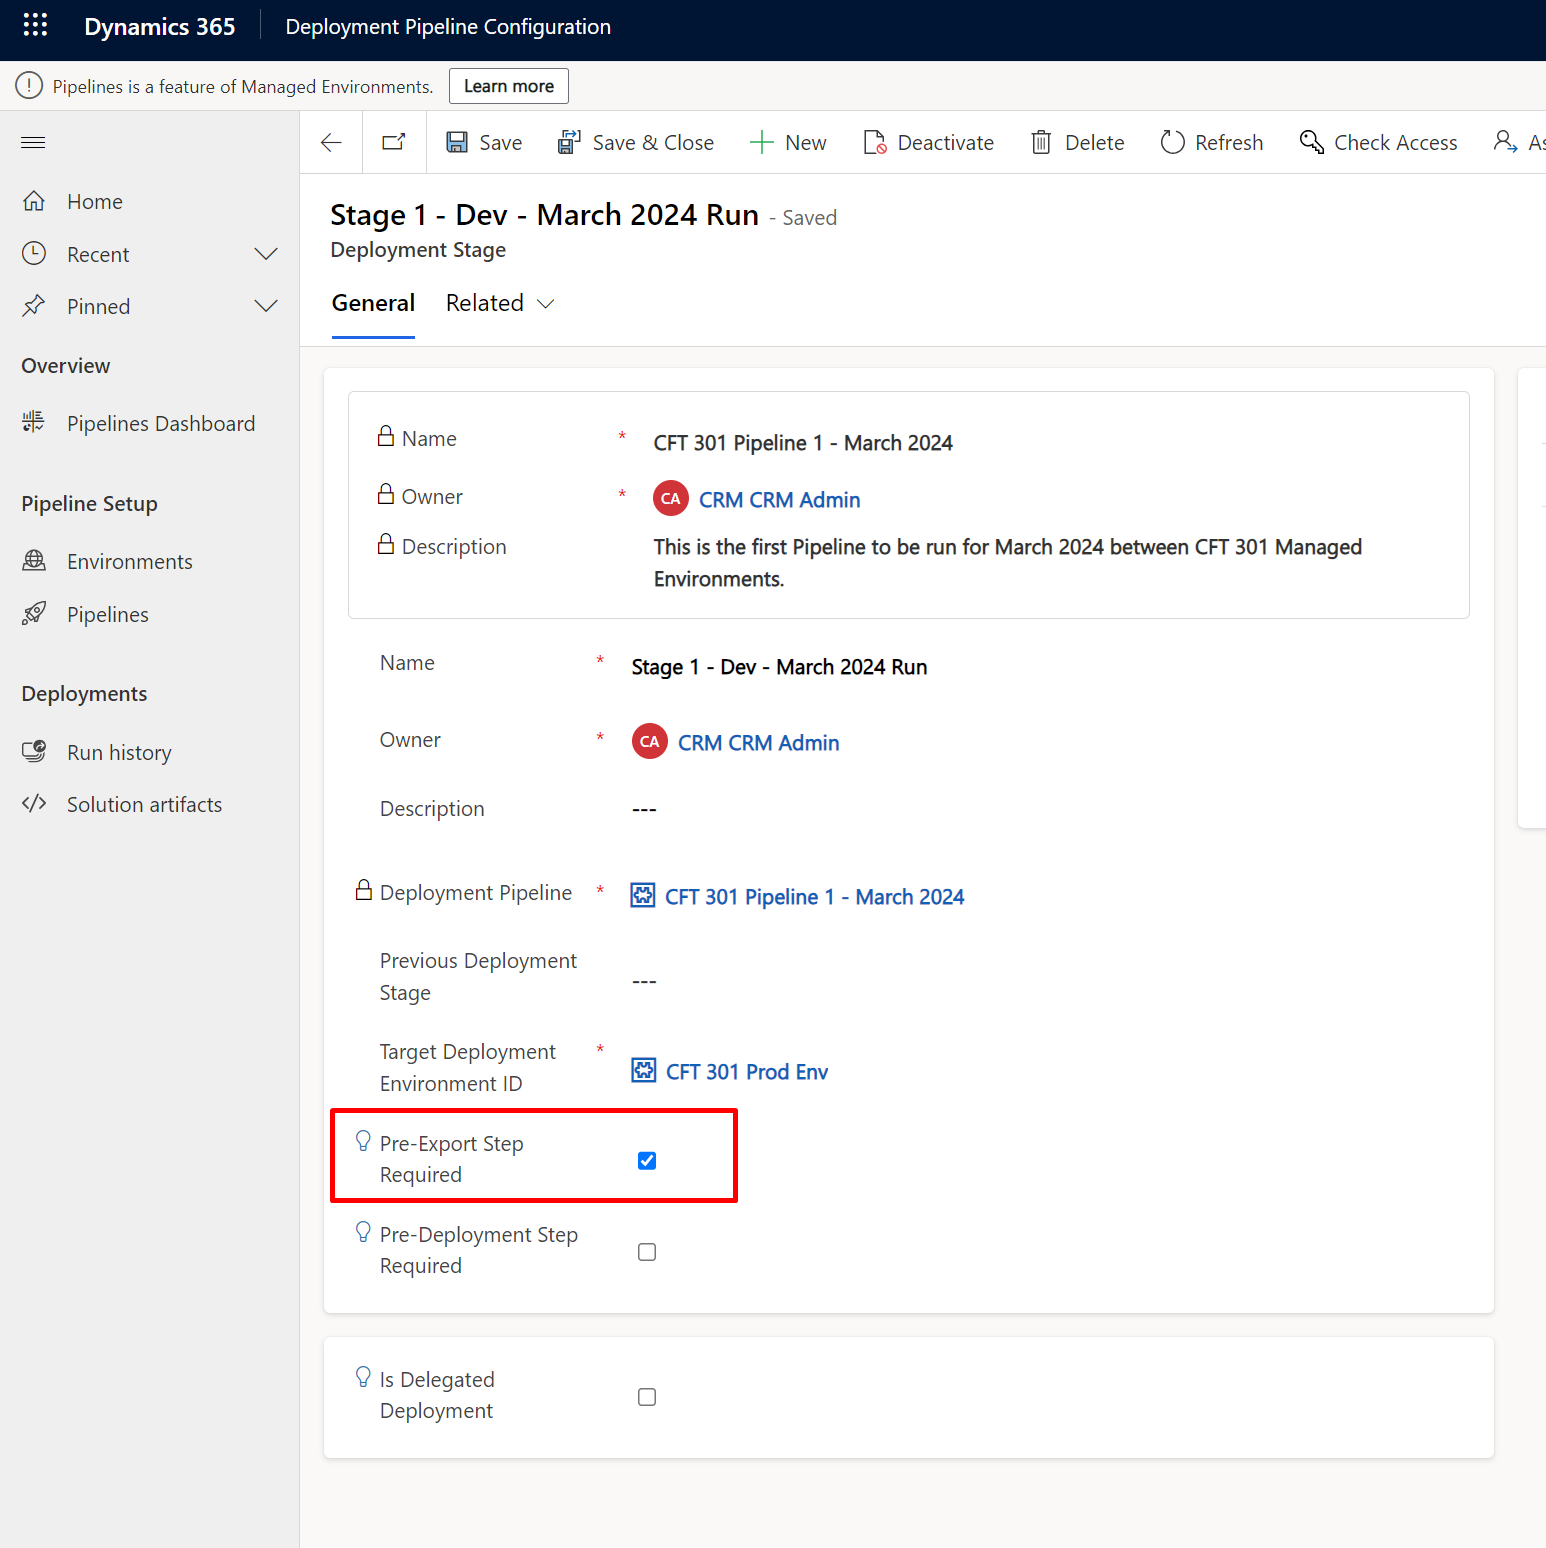
Pre-Export Step Required

While setting up your Pipeline, in case you were wondering what Pre-Export Step Required setting was, see below –

  1. Once you mark this field as checked/Required, save the record and it’ll appear like this on the record.

  2. What this does is, it runs the trigger action ‘OnDeploymentRequested’

  3. And once this Flow is trigger based on this Action, you can perform custom logic to be carried out and be successful before the deployment is carried forward.
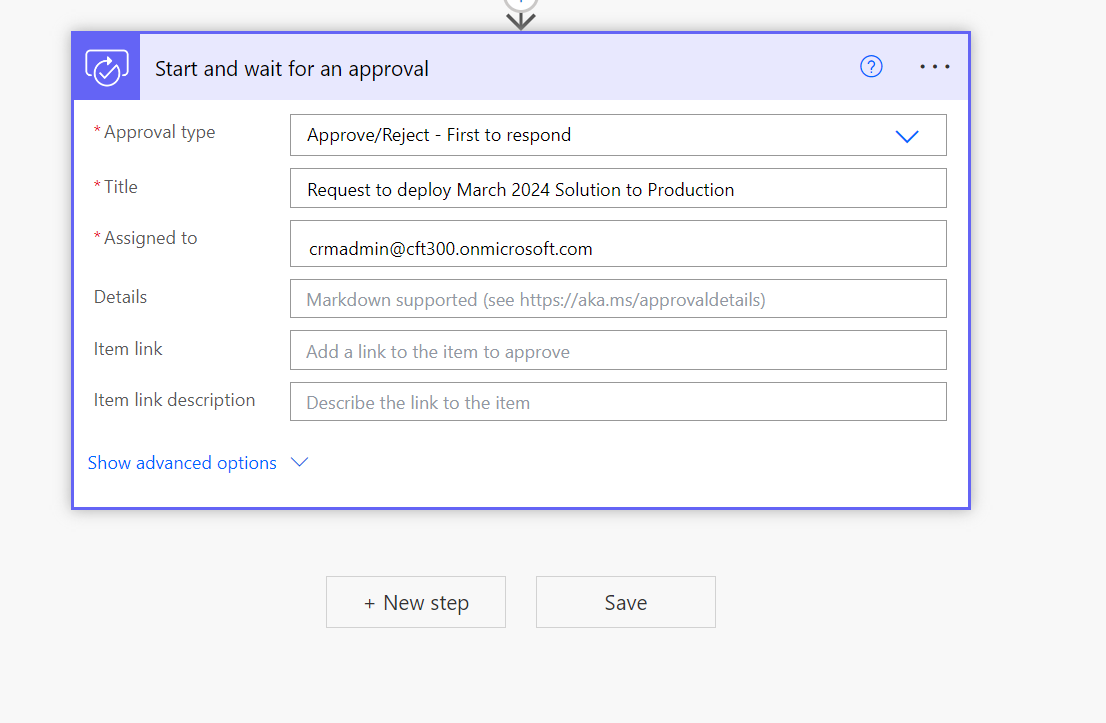
    In this example, I’m setting a simple Approval process to be in place so that the Admin is aware and approves all the Deployment requests.

  4. Now, once an Approval is received, you need to check the status of the request and if it’s Approved, you need to run Perform an unbound action to initiate the Action ‘UpdatePreExportStepStatus
    You’ll need to pass the StageRunId – You’ll get this in the Dynamics Content Properties of the Flow itself from the trigger.
    Then, you need to set the Status of 20 – this means Approved.
    For rejection, the status to set is 30.

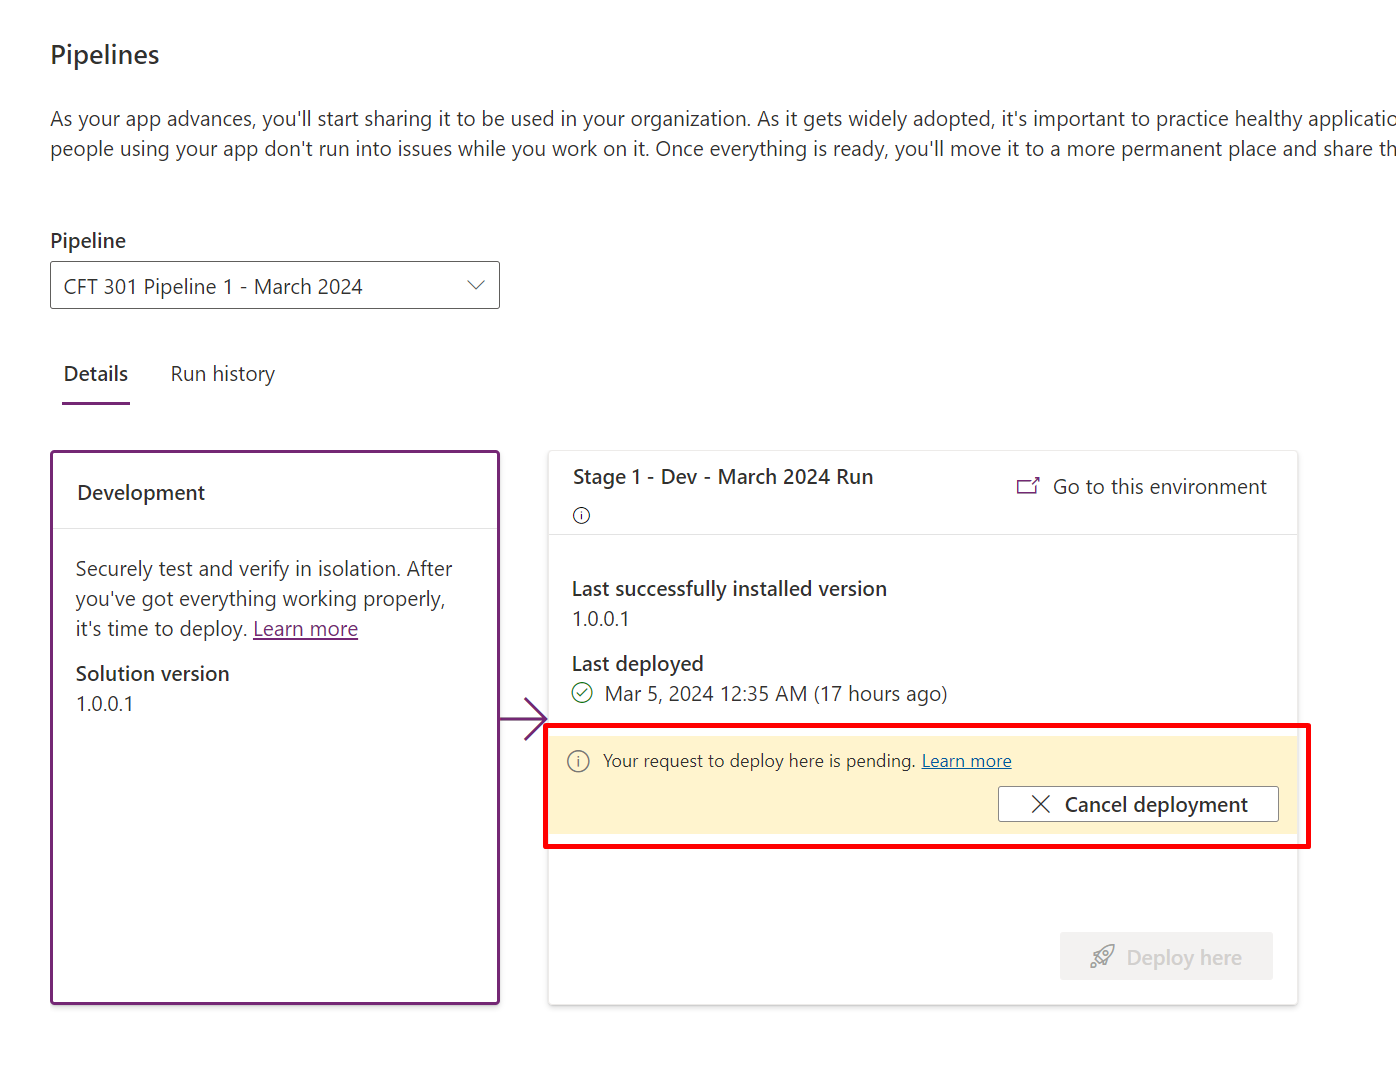
  5. Now, once this Flow is in place, every time a Pipeline is Run to deploy the solution, it’ll first wait for the Approval process to complete and the pipeline itself will show the below message.

  6. This status can also be seen in the Deployment Stages in the ‘Deployment Pipeline Configuration‘ app as well.

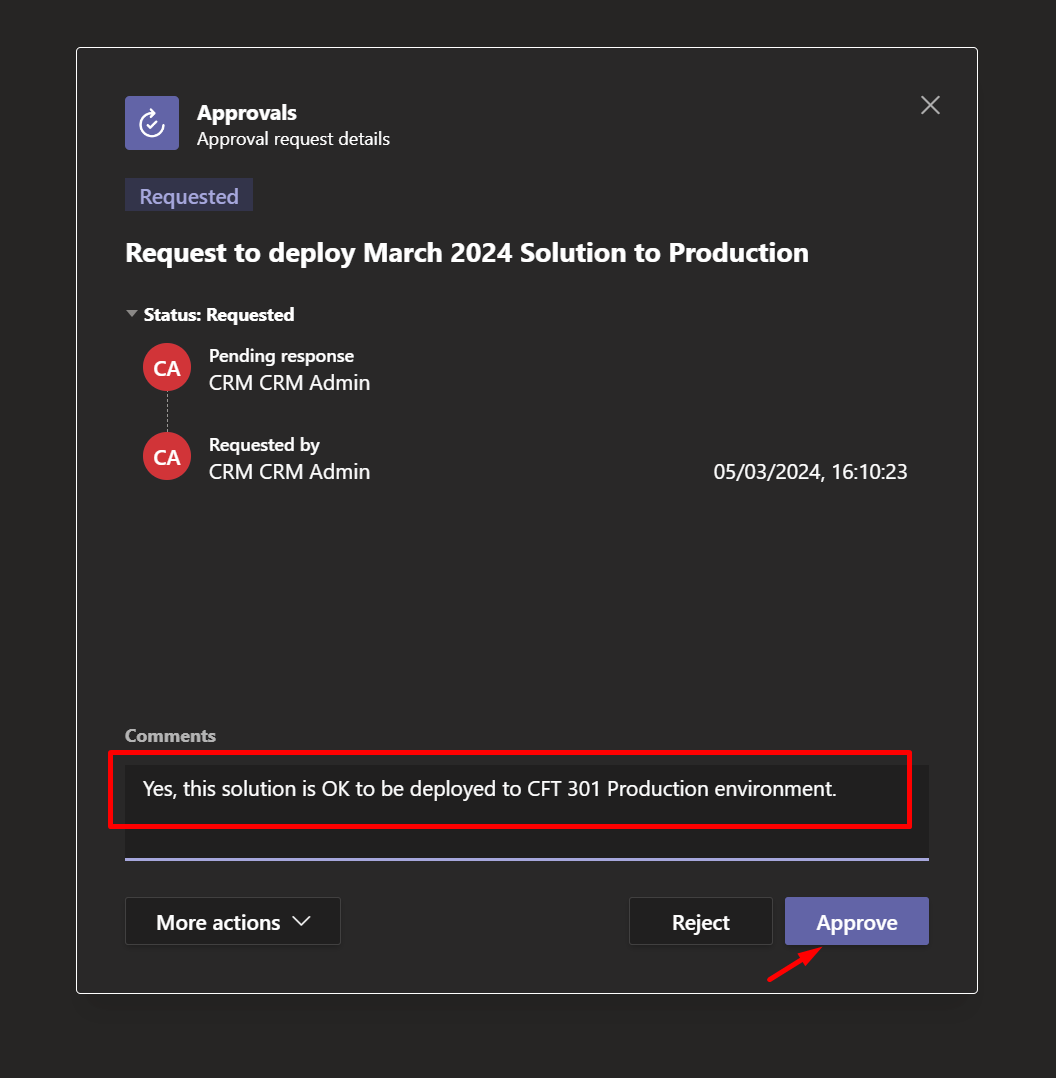
  7. Now, the Admin on the other hand, will receive a Power Automate Approval like this (based on whatever you have configured). This is received on both Approvals in Teams and in Power Automate as well.

  8. Once the Approver approves, I’ll enter some notes while approving.

  9. The pipeline will then proceed to deploy to production.

  10. And this will also proceed on the UI in Pipelines as well.

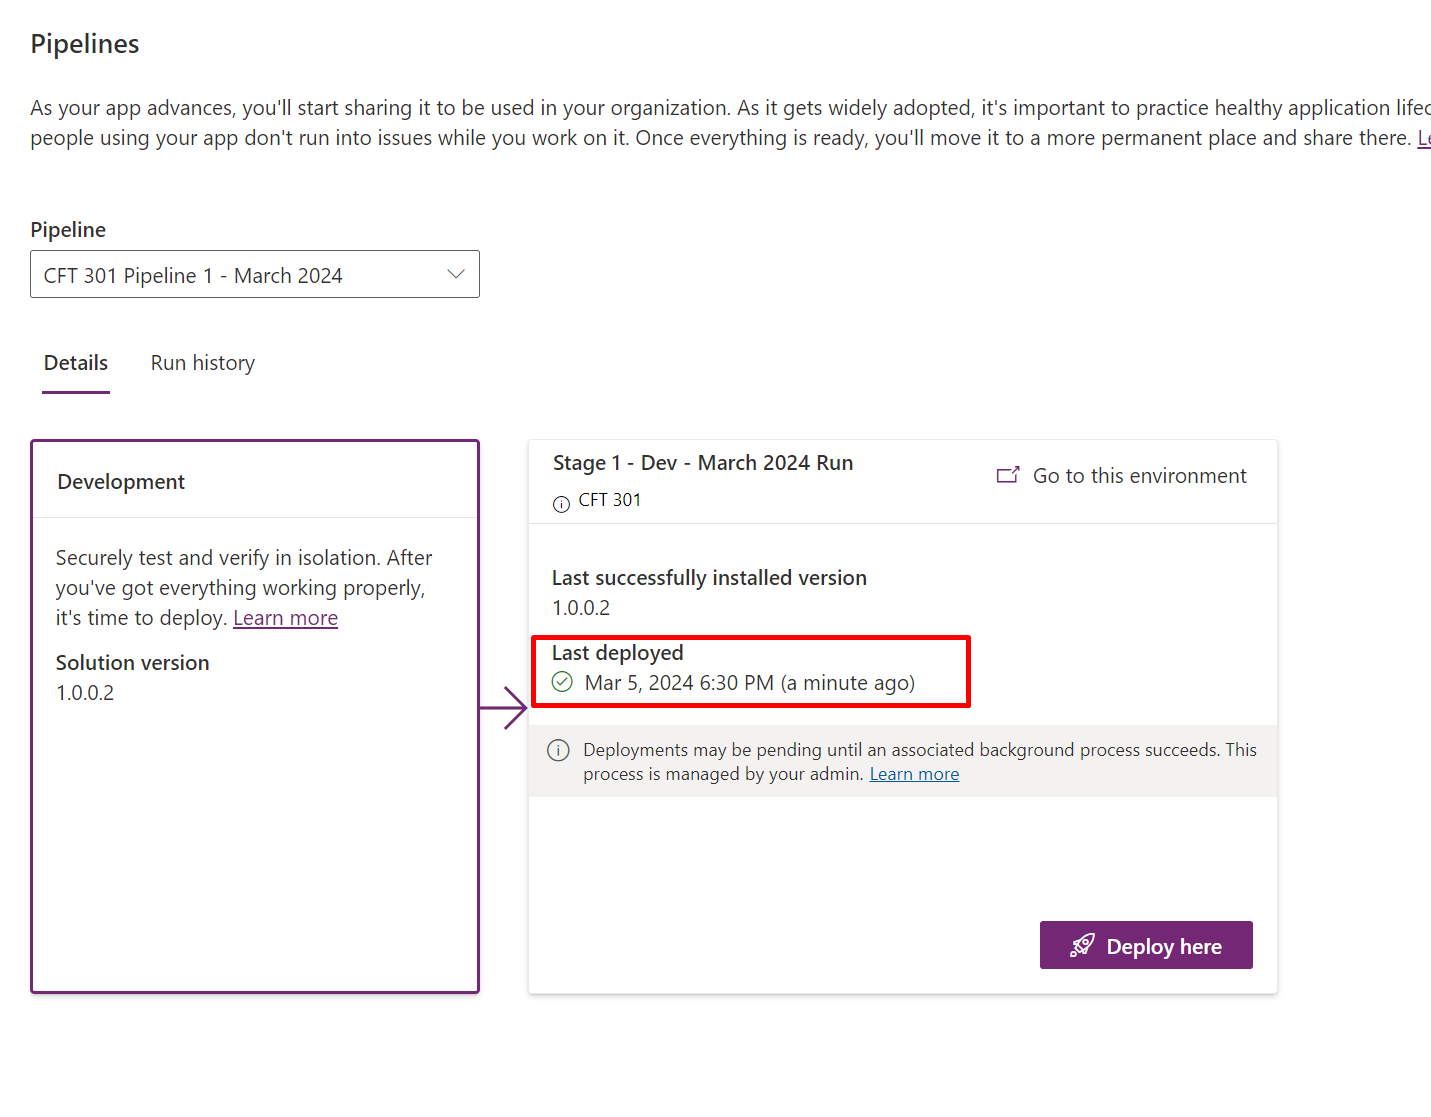
  11. Once deployed, you’ll see that this is completed Successfully if there are no issues.

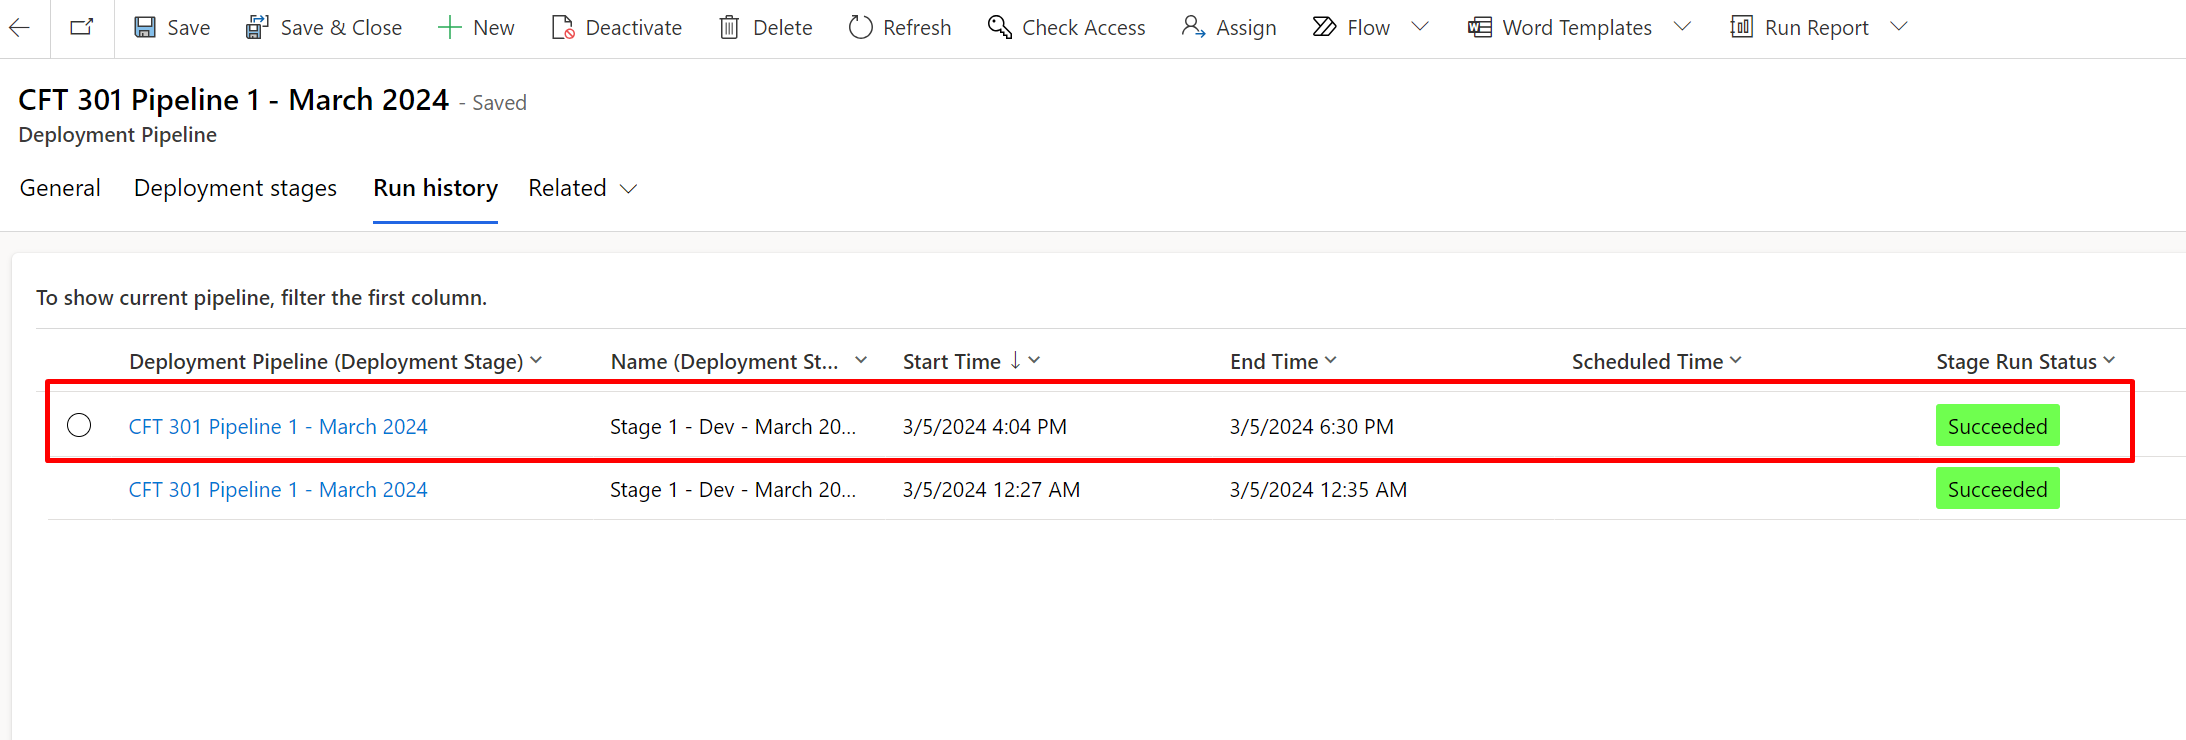
  12. You can also see the History. The End Time will represent when it was completed as opposed to Start Time representing when the Deployment Request was initiated.

  13. And also in the ‘Deployment Pipeline Configuration‘ app.


Here’s official Microsoft documentation on how you have Gated Extensions like these to be in place in Power Platform Pipelines – https://learn.microsoft.com/en-us/power-platform/alm/extend-pipelines#gated-extensions-available?WT.mc_id=DX-MVP-5003911

Hope this was useful!

Thank you!

Power Platform Pipelines | Blog Series

Here’s a blog series to get you up to speed on Power Platform Pipelines!

Setting up and Running Power Platform Pipelines

Here is what you need to get done in order to setup Power Platform Pipelines –

  1. Setup Power Platform Pipelines
  2. Run a Power Platform Pipeline

Advanced Settings

ScenarioBlog
Once request for deployment is submitted.Pre-Export Step Required setting in Deployment Pipeline | Power Platform Pipelines

Here’s official Microsoft Documentation on Power Platform Pipelines – https://learn.microsoft.com/en-us/power-platform/alm/pipelines?WT.mc_id=DX-MVP-5003911

Hope this was useful!

Thank you!
Run a Power Platform Pipeline

In case you setup your first Power Platform Pipeline and looking to test it out? This post is for you.

Or if you haven’t yet configured your Power Platform Pipelines first, refer this post – Setup Power Platform Pipelines

Now that you have your basic Power Platform Pipeline set in place, let’s run a created Pipeline!

Run Power Platform Pipeline

Here’s what you need to do in order to Run your pipeline –

  1. Go to the Dev environment on which you have Hosted your pipeline (or which is supposed to be your first environment from where all the customization/configuration should move over).
    Go to the Solution which you want to Run through the Pipeline.
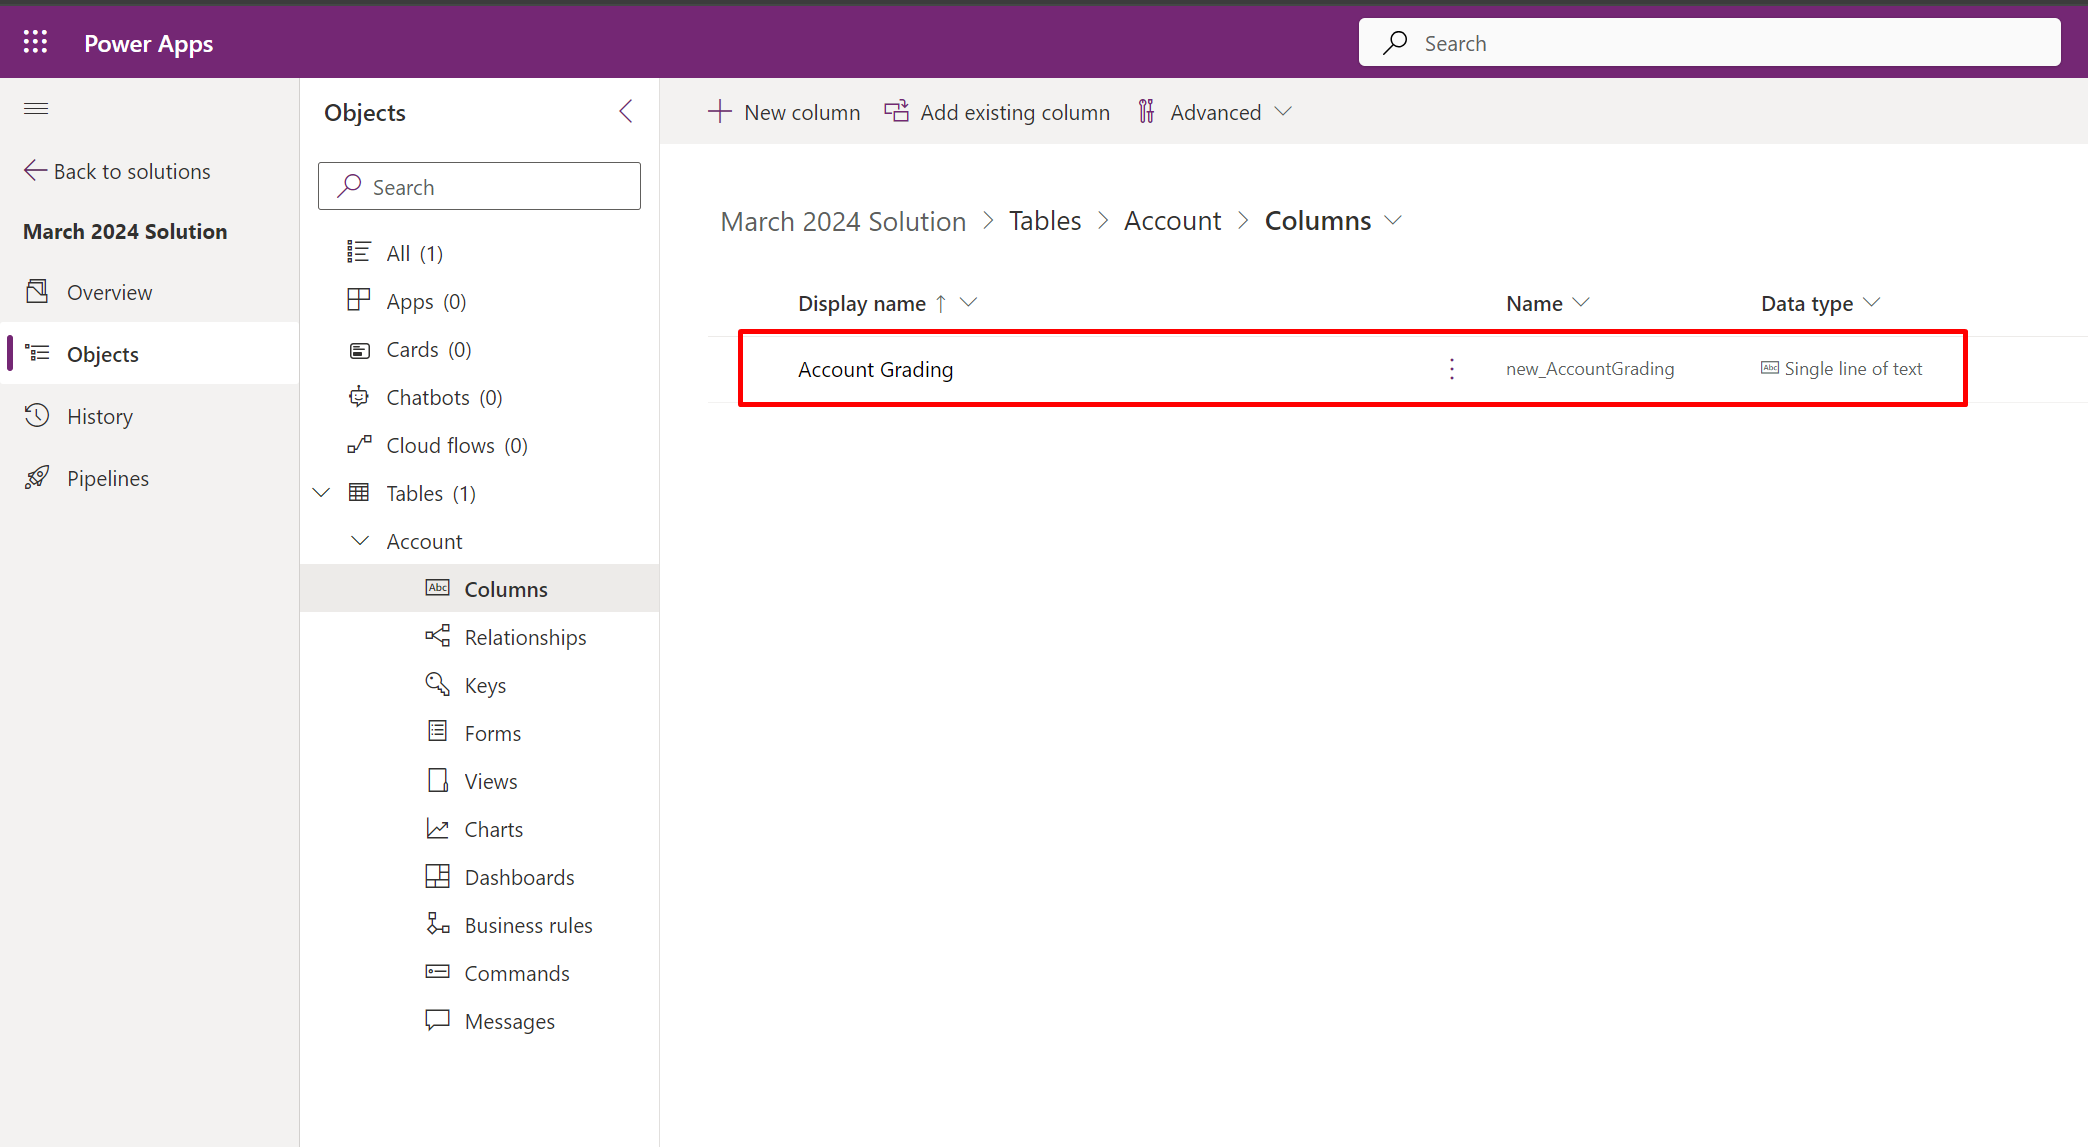
    For the simplicity of this example, this Solution has just 1 custom column on the Account table.

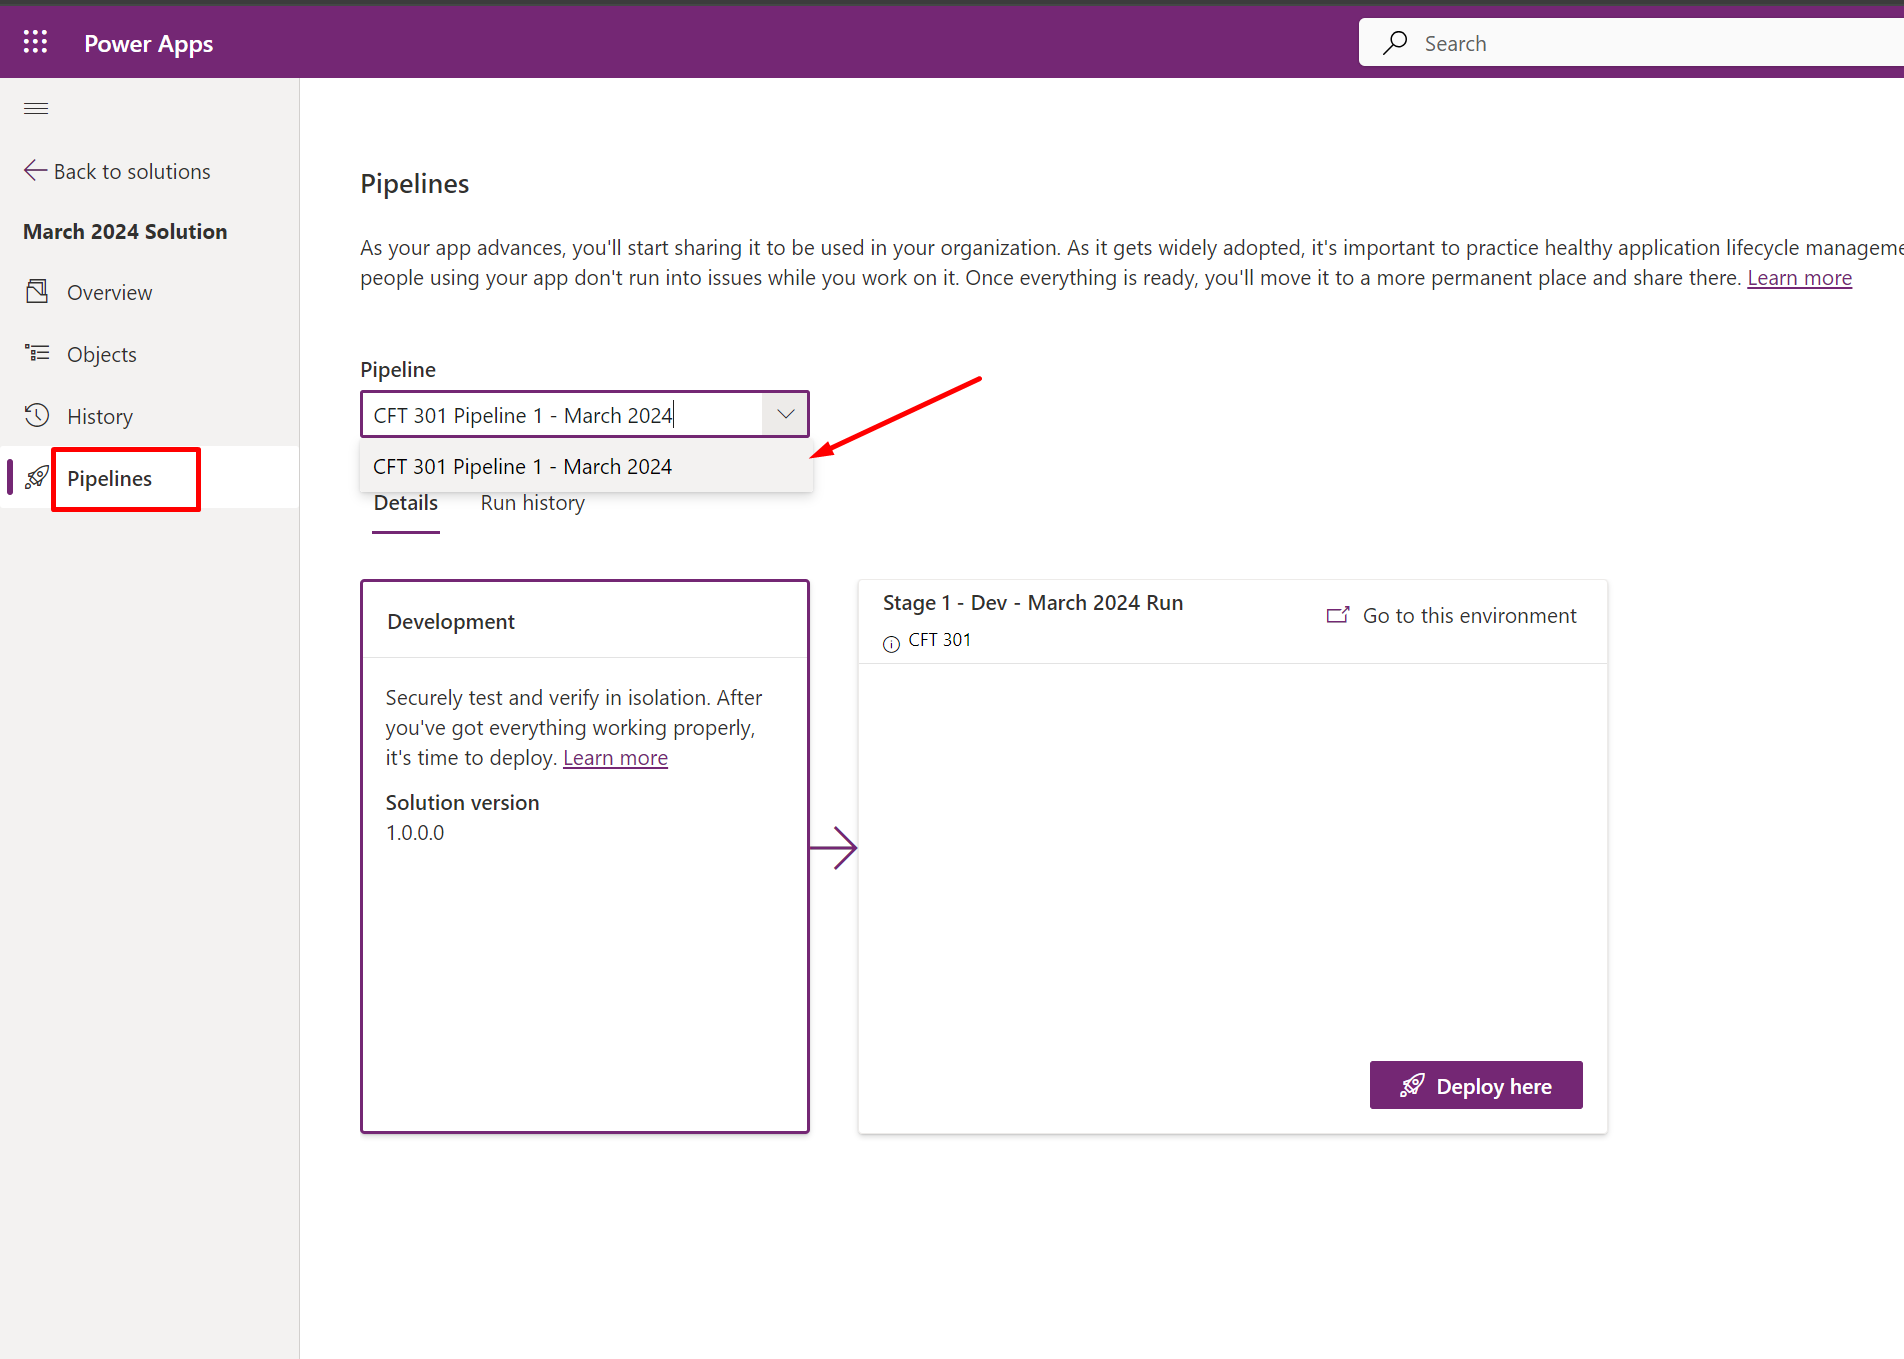
  2. Now, click on Pipelines and look for the Deployed Pipeline which is ready to be used.

  3. Now, once you get to see the stages which you have set in the blog post – Setup Power Platform Pipelines, those stages will appear here.
    Then, verify the environment details mentioned and then click on Deploy here once you are sure.

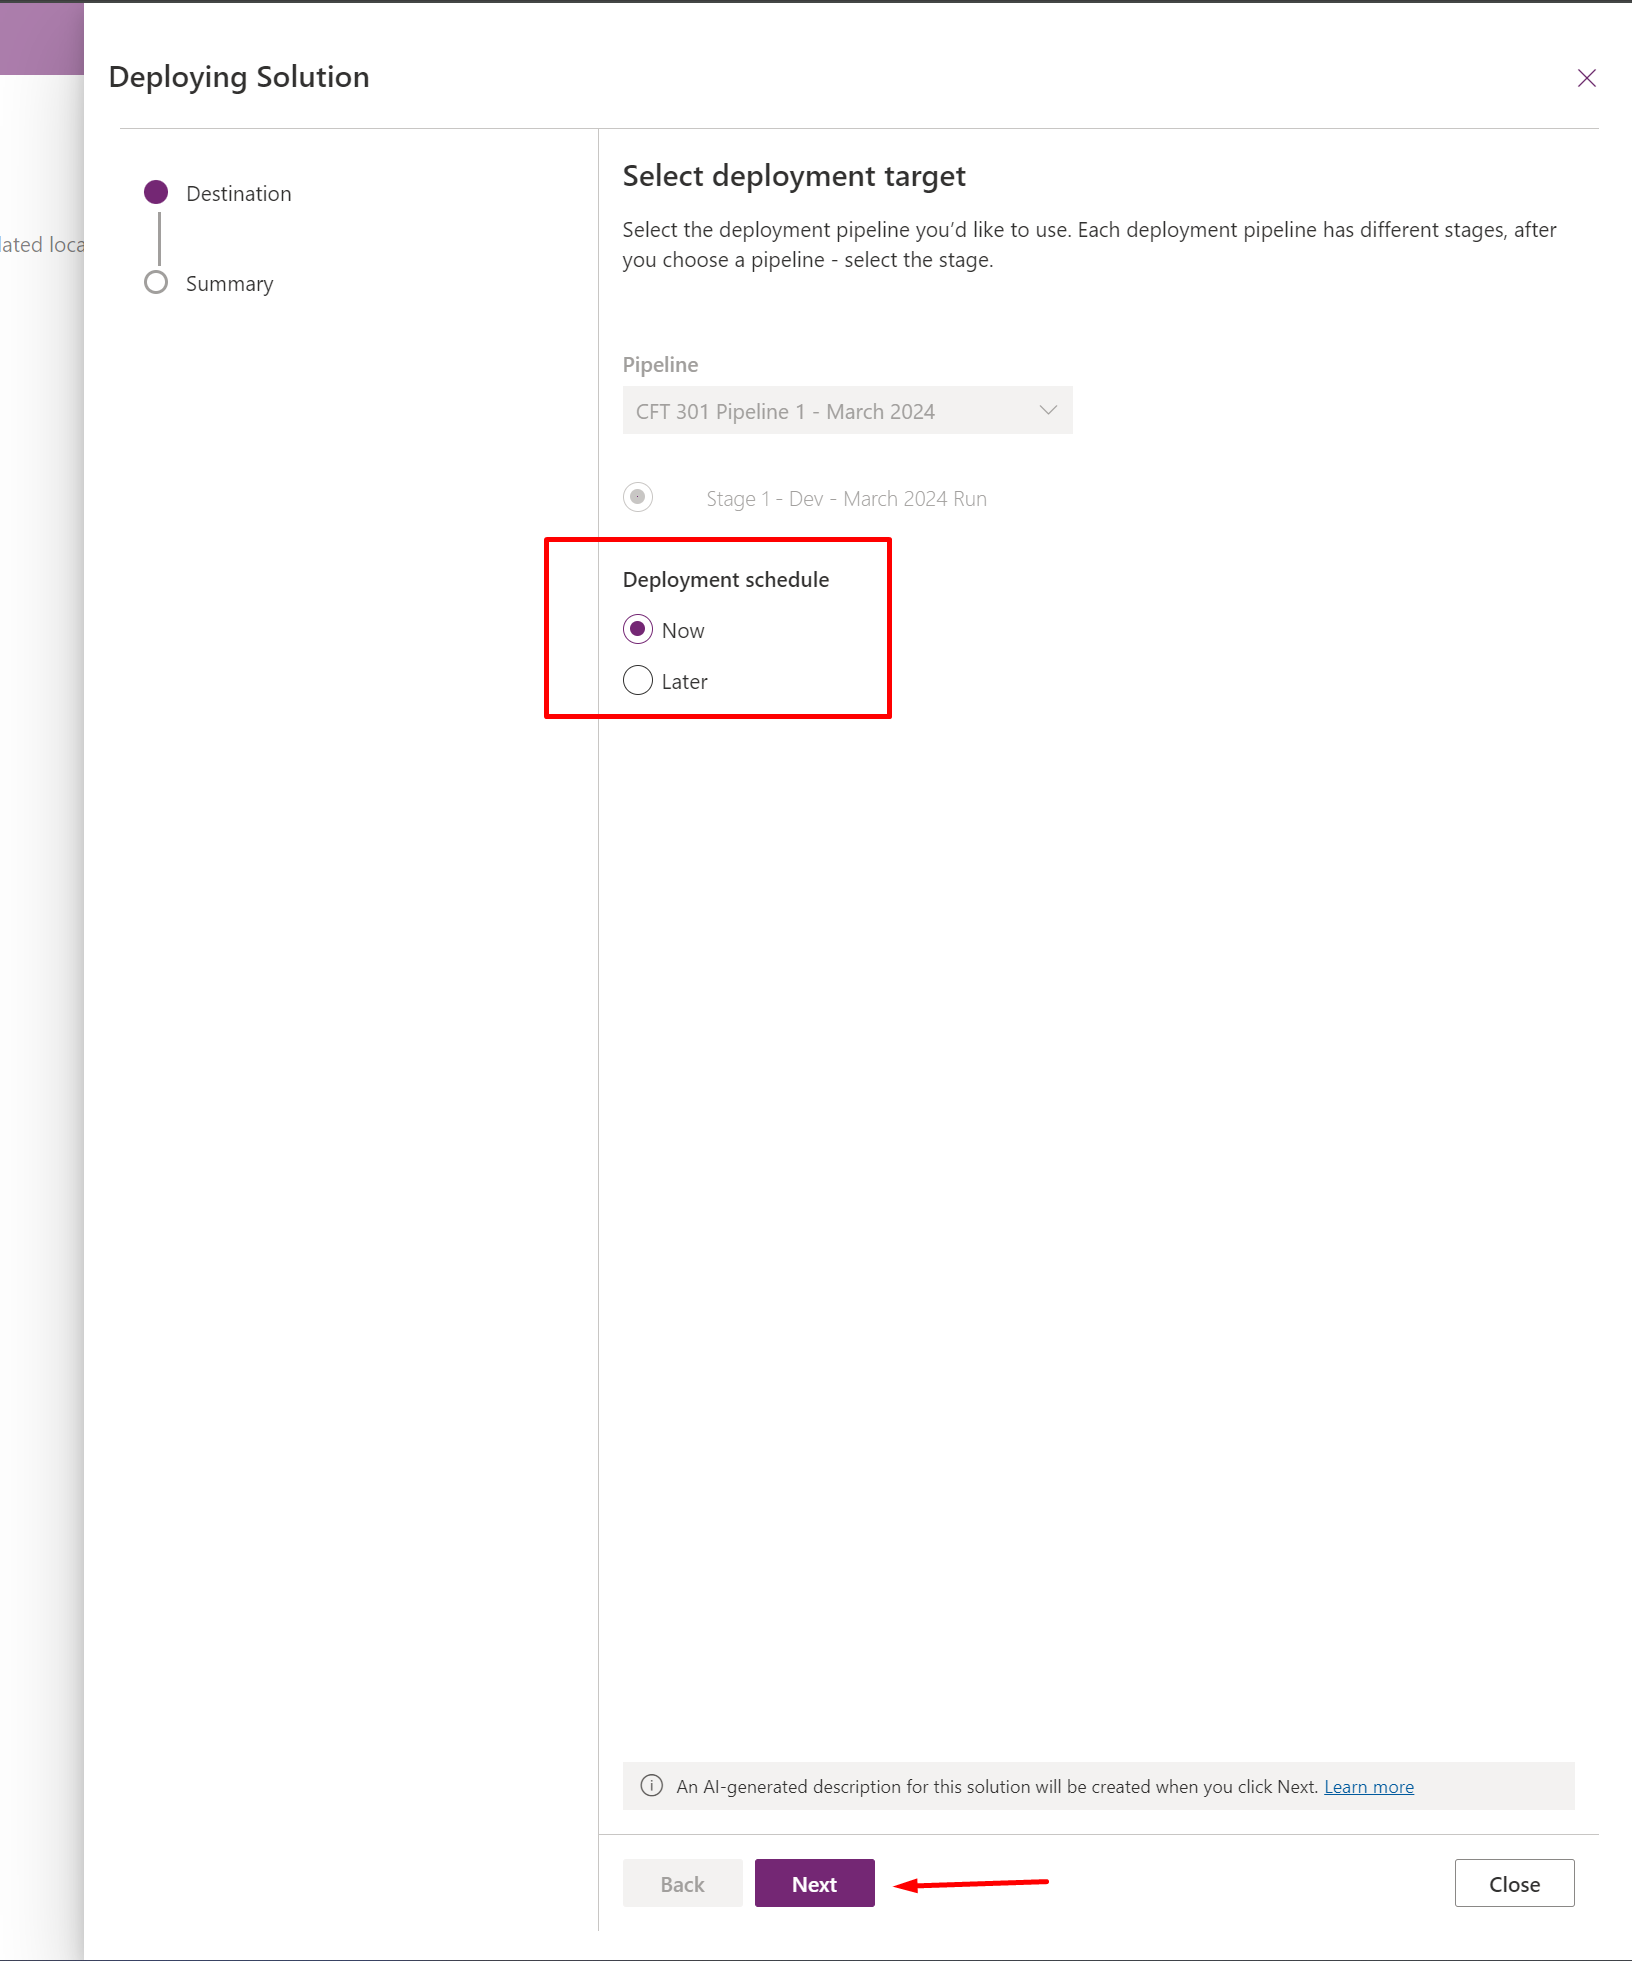
  4. Now, once you click on Deploy here, you’ll be given option to choose when you want to deploy – whether now or later.

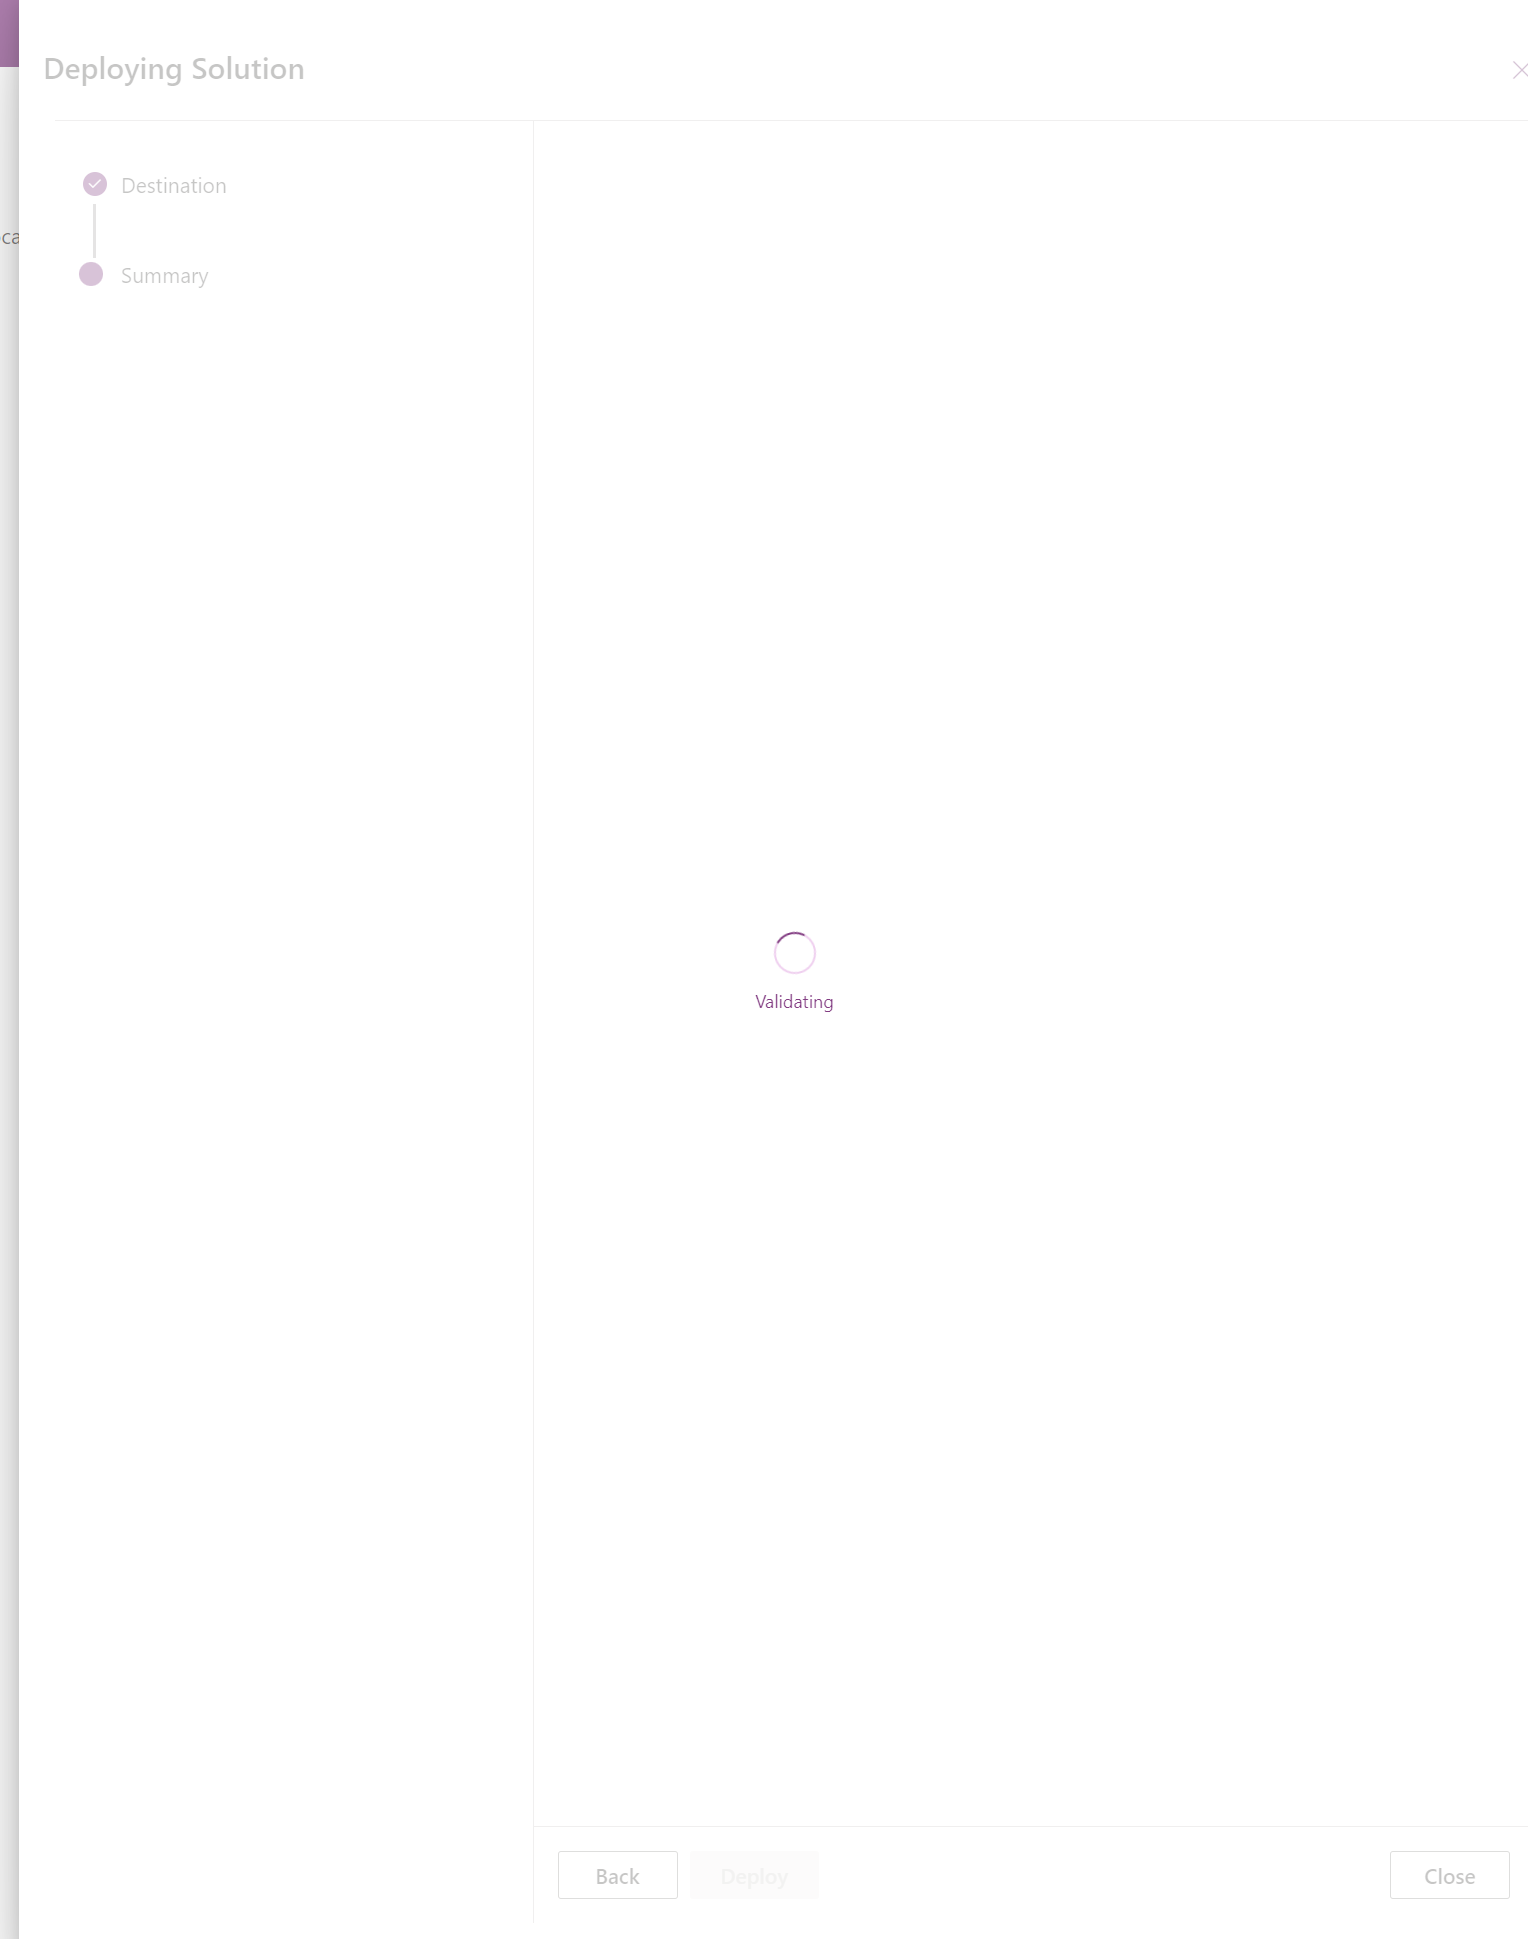
  5. For this example, I’m choosing Now instead of scheduling it for later. Then, I click Next and it’ll go into Validating Stage.

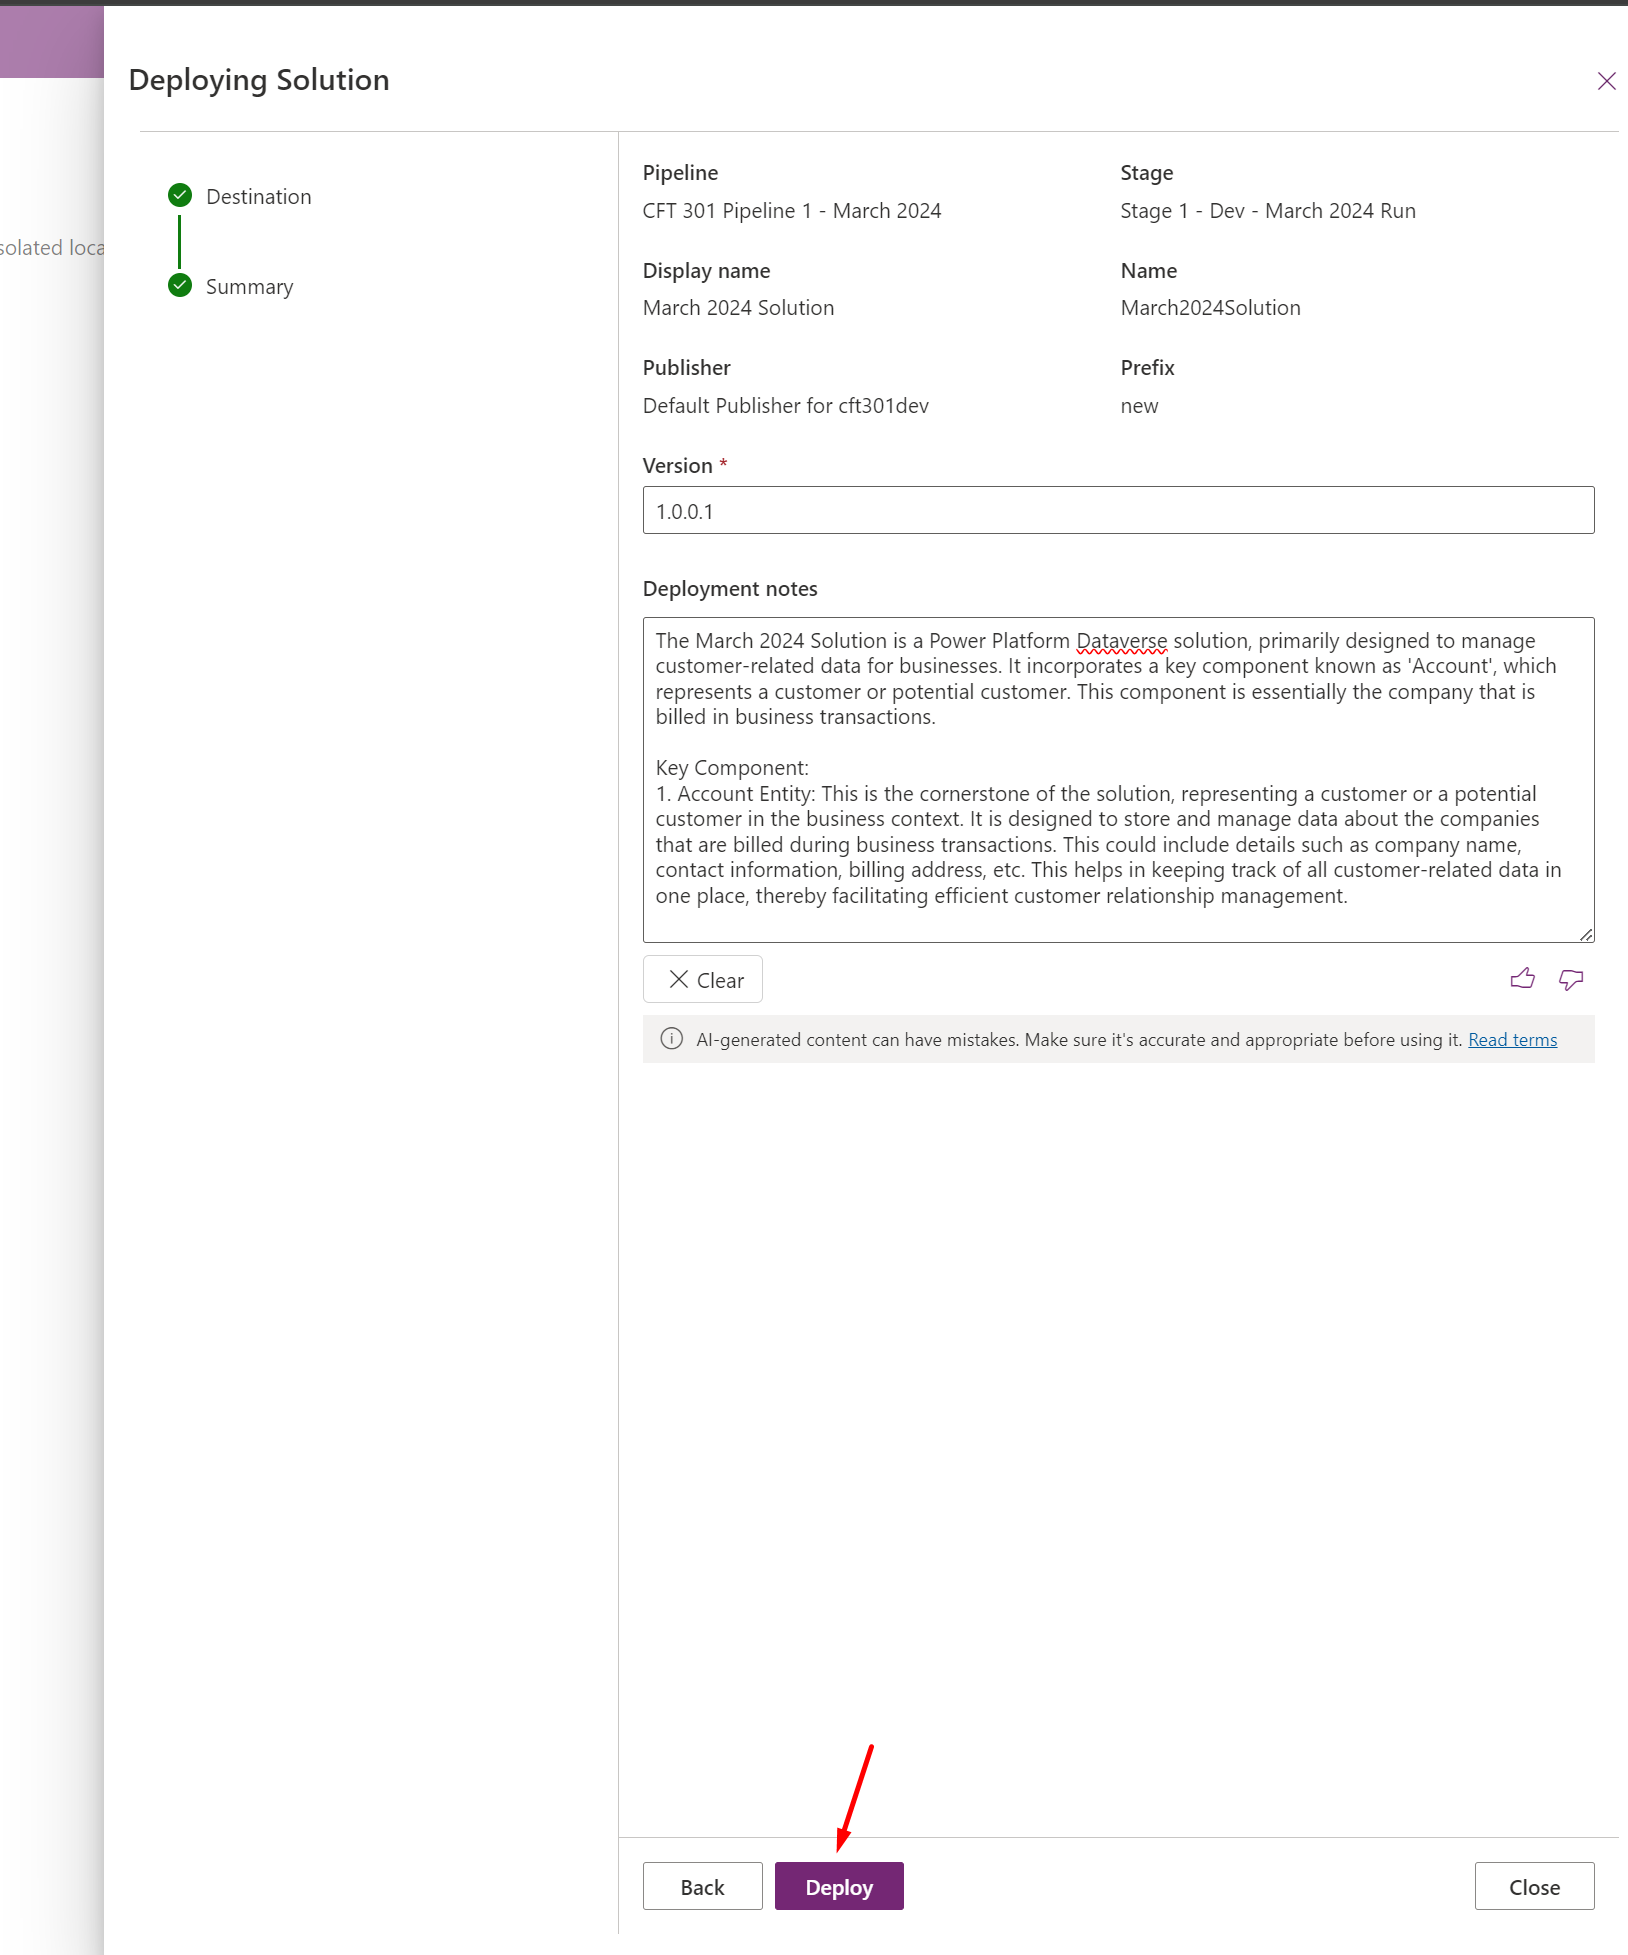
  6. Once it all looks good, you’ll get AI generated notes already if you are in the US Region (at the time of writing this post). Then, click Deploy once everything looks good.

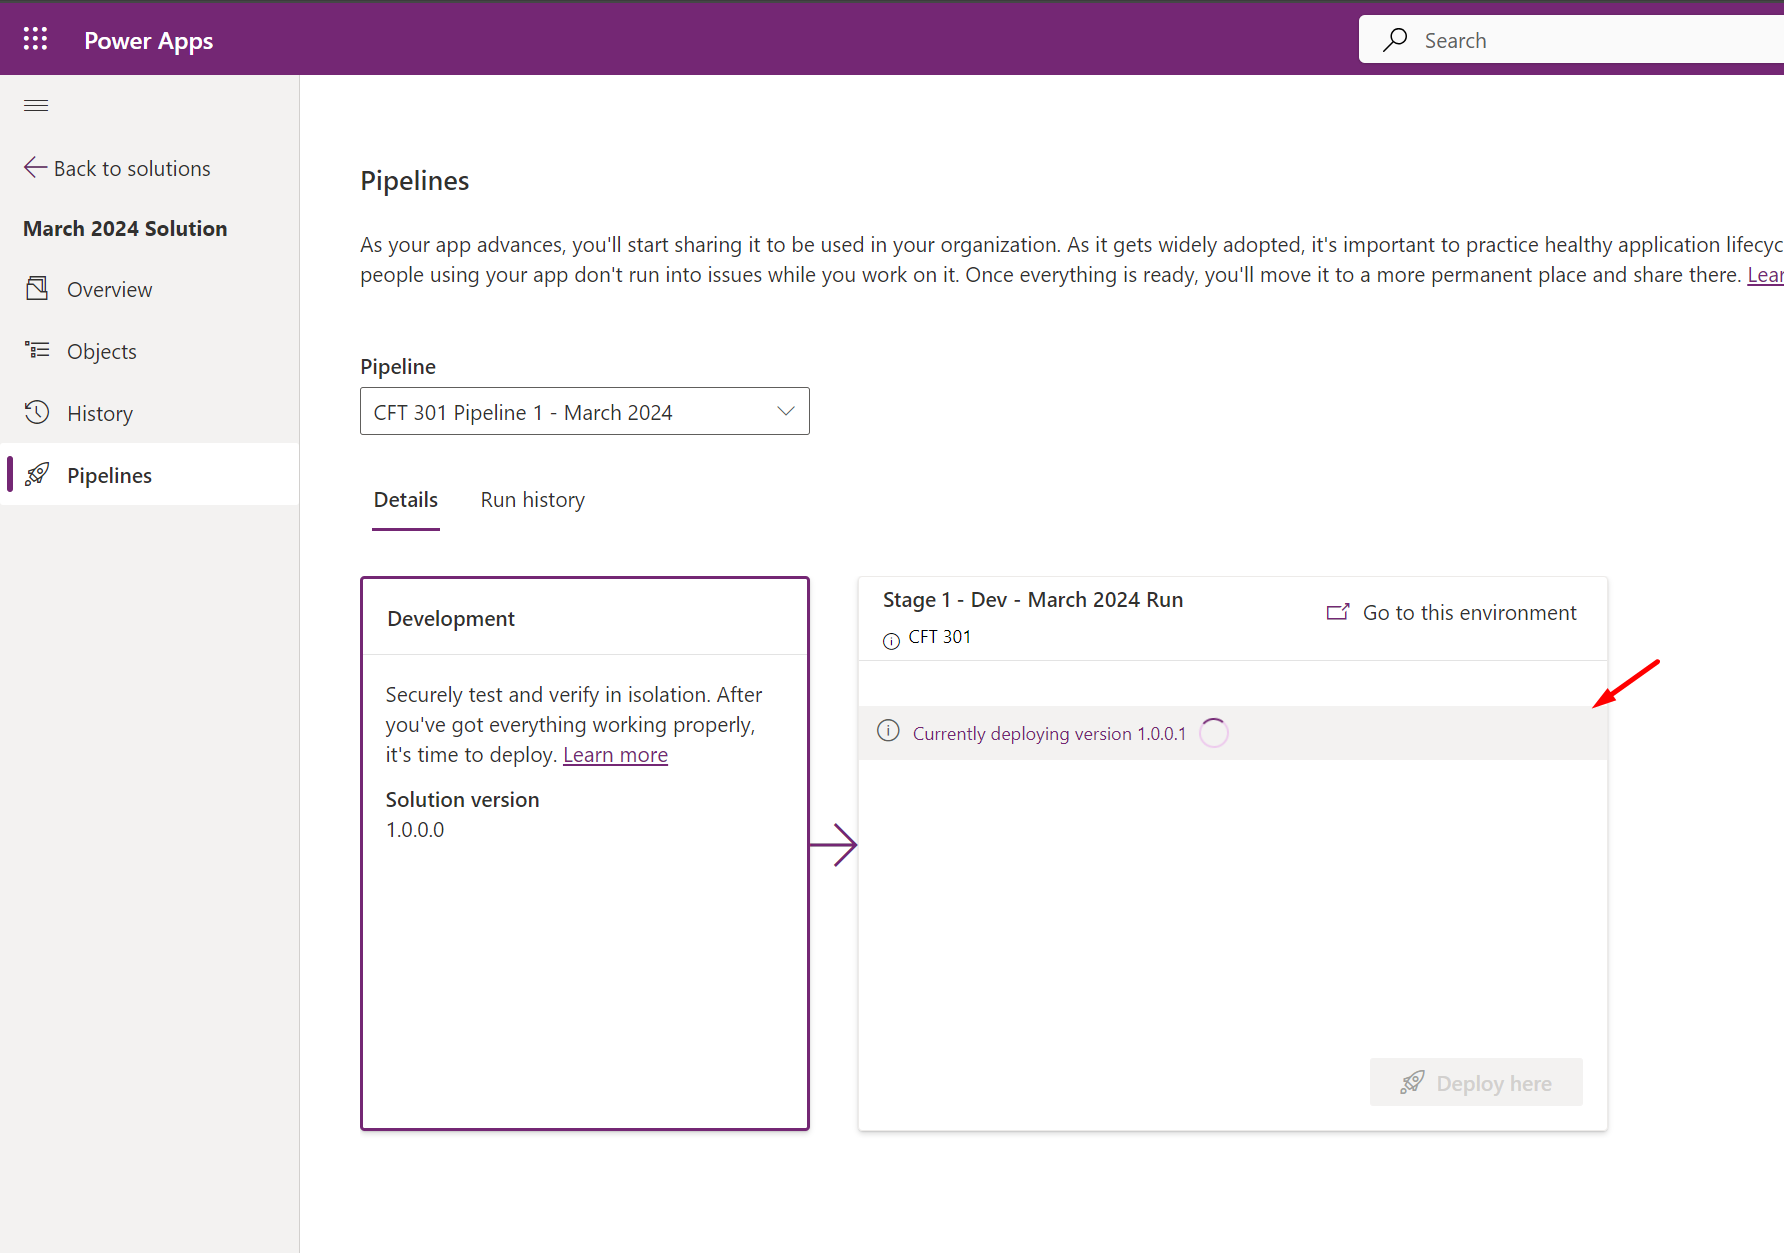
  7. Once this is in progress in the background, you’ll see that the pipeline is deploying your solution.

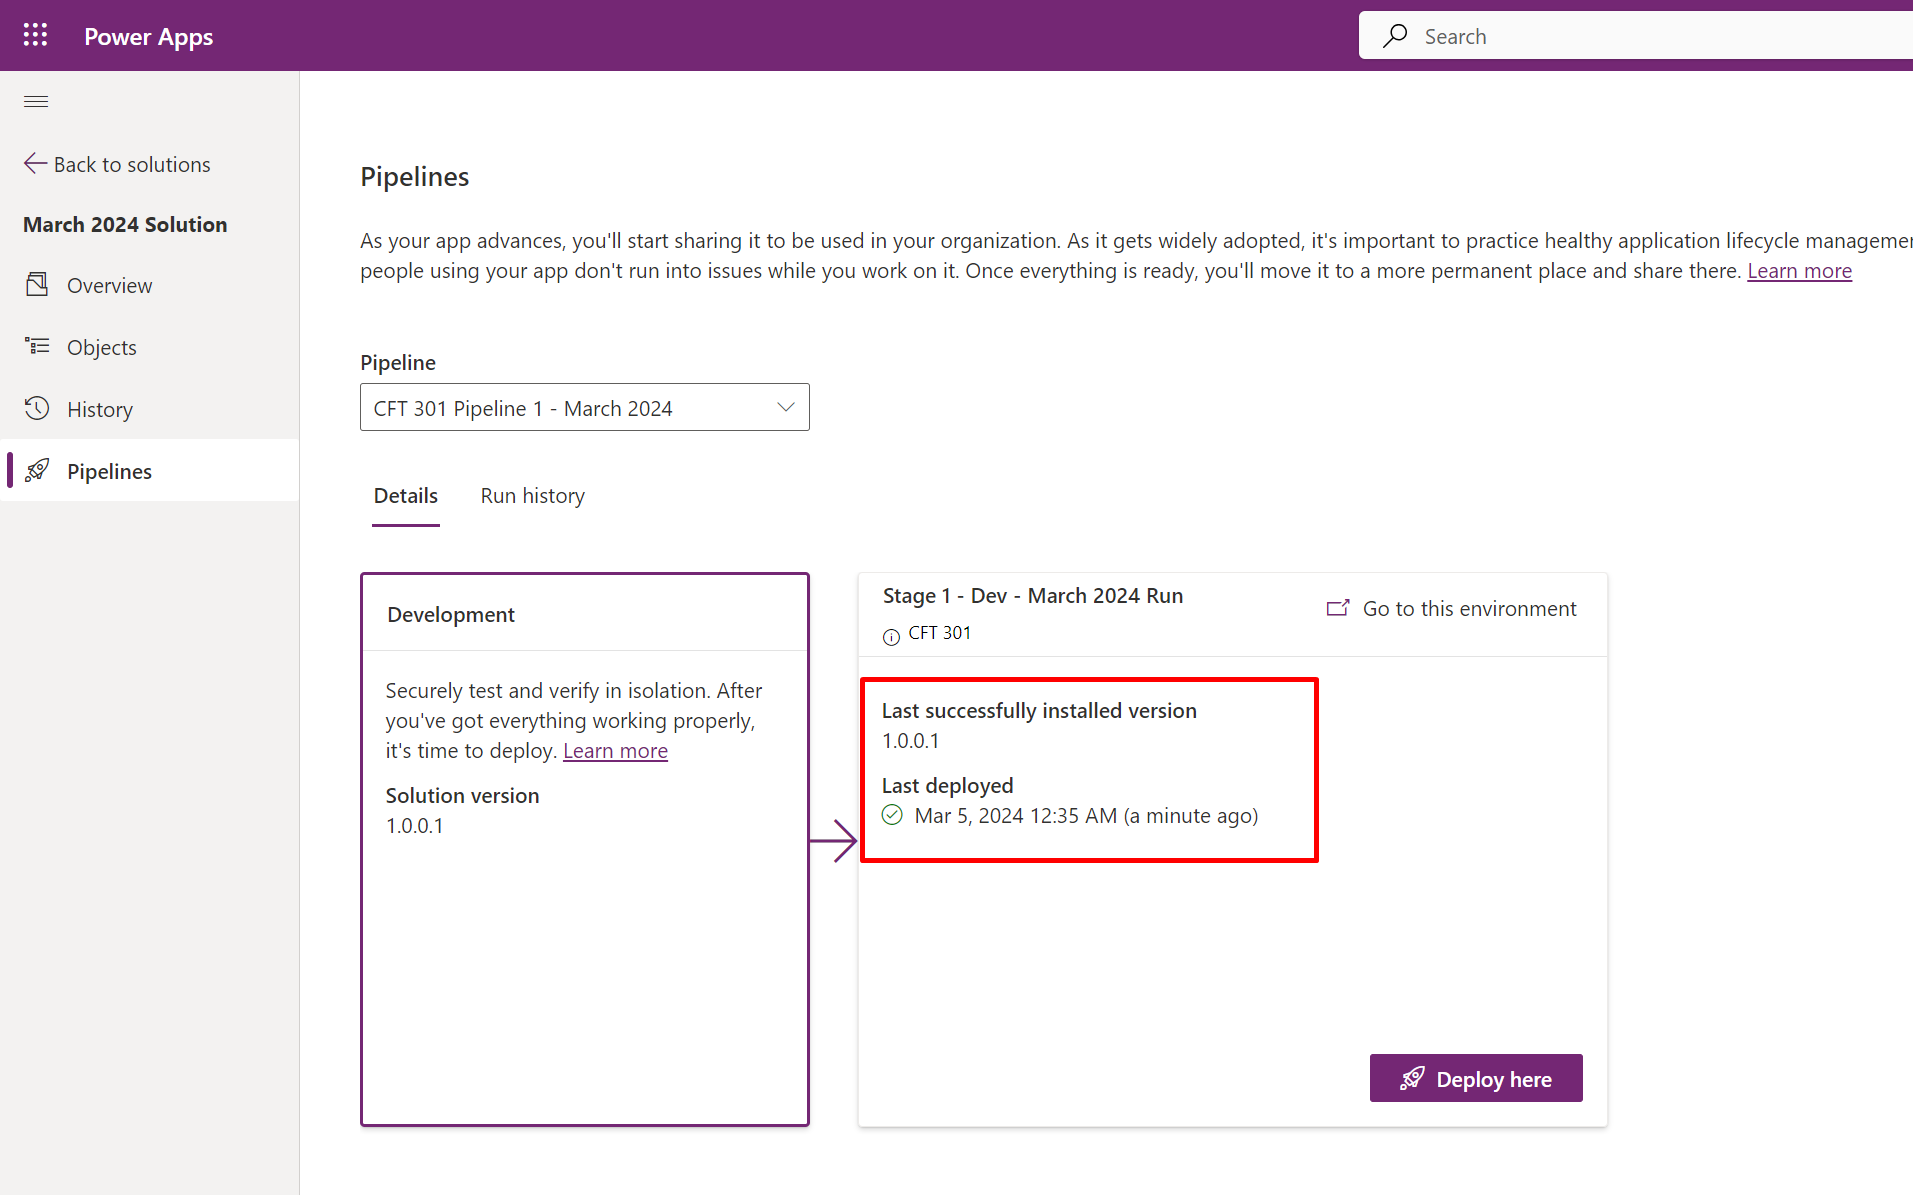
  8. Once this is completed, you’ll see that this is deployed successfully.


  9. And this will be successfully deployed to the Target environment like so in the Managed Solutions section.

Hope this short tutorial was helpful!

Hope this was useful!

Thank you!

Setup Power Platform Pipelines

Given that you need to setup Power Platform Pipelines, here’s a post for you!
This post will walk you through on how you can setup Power Platform Pipelines.

Pre-Requisites

Here’s what you need to setup in order to enable Power Platform Pipelines –

  1. You need to enable Managed Environments for the environments which need to participate in Power Platform Pipelines. Here’s a post on Managed Environment which I’ve written in the past – Enable Managed Environments in Power Platform Admin Center

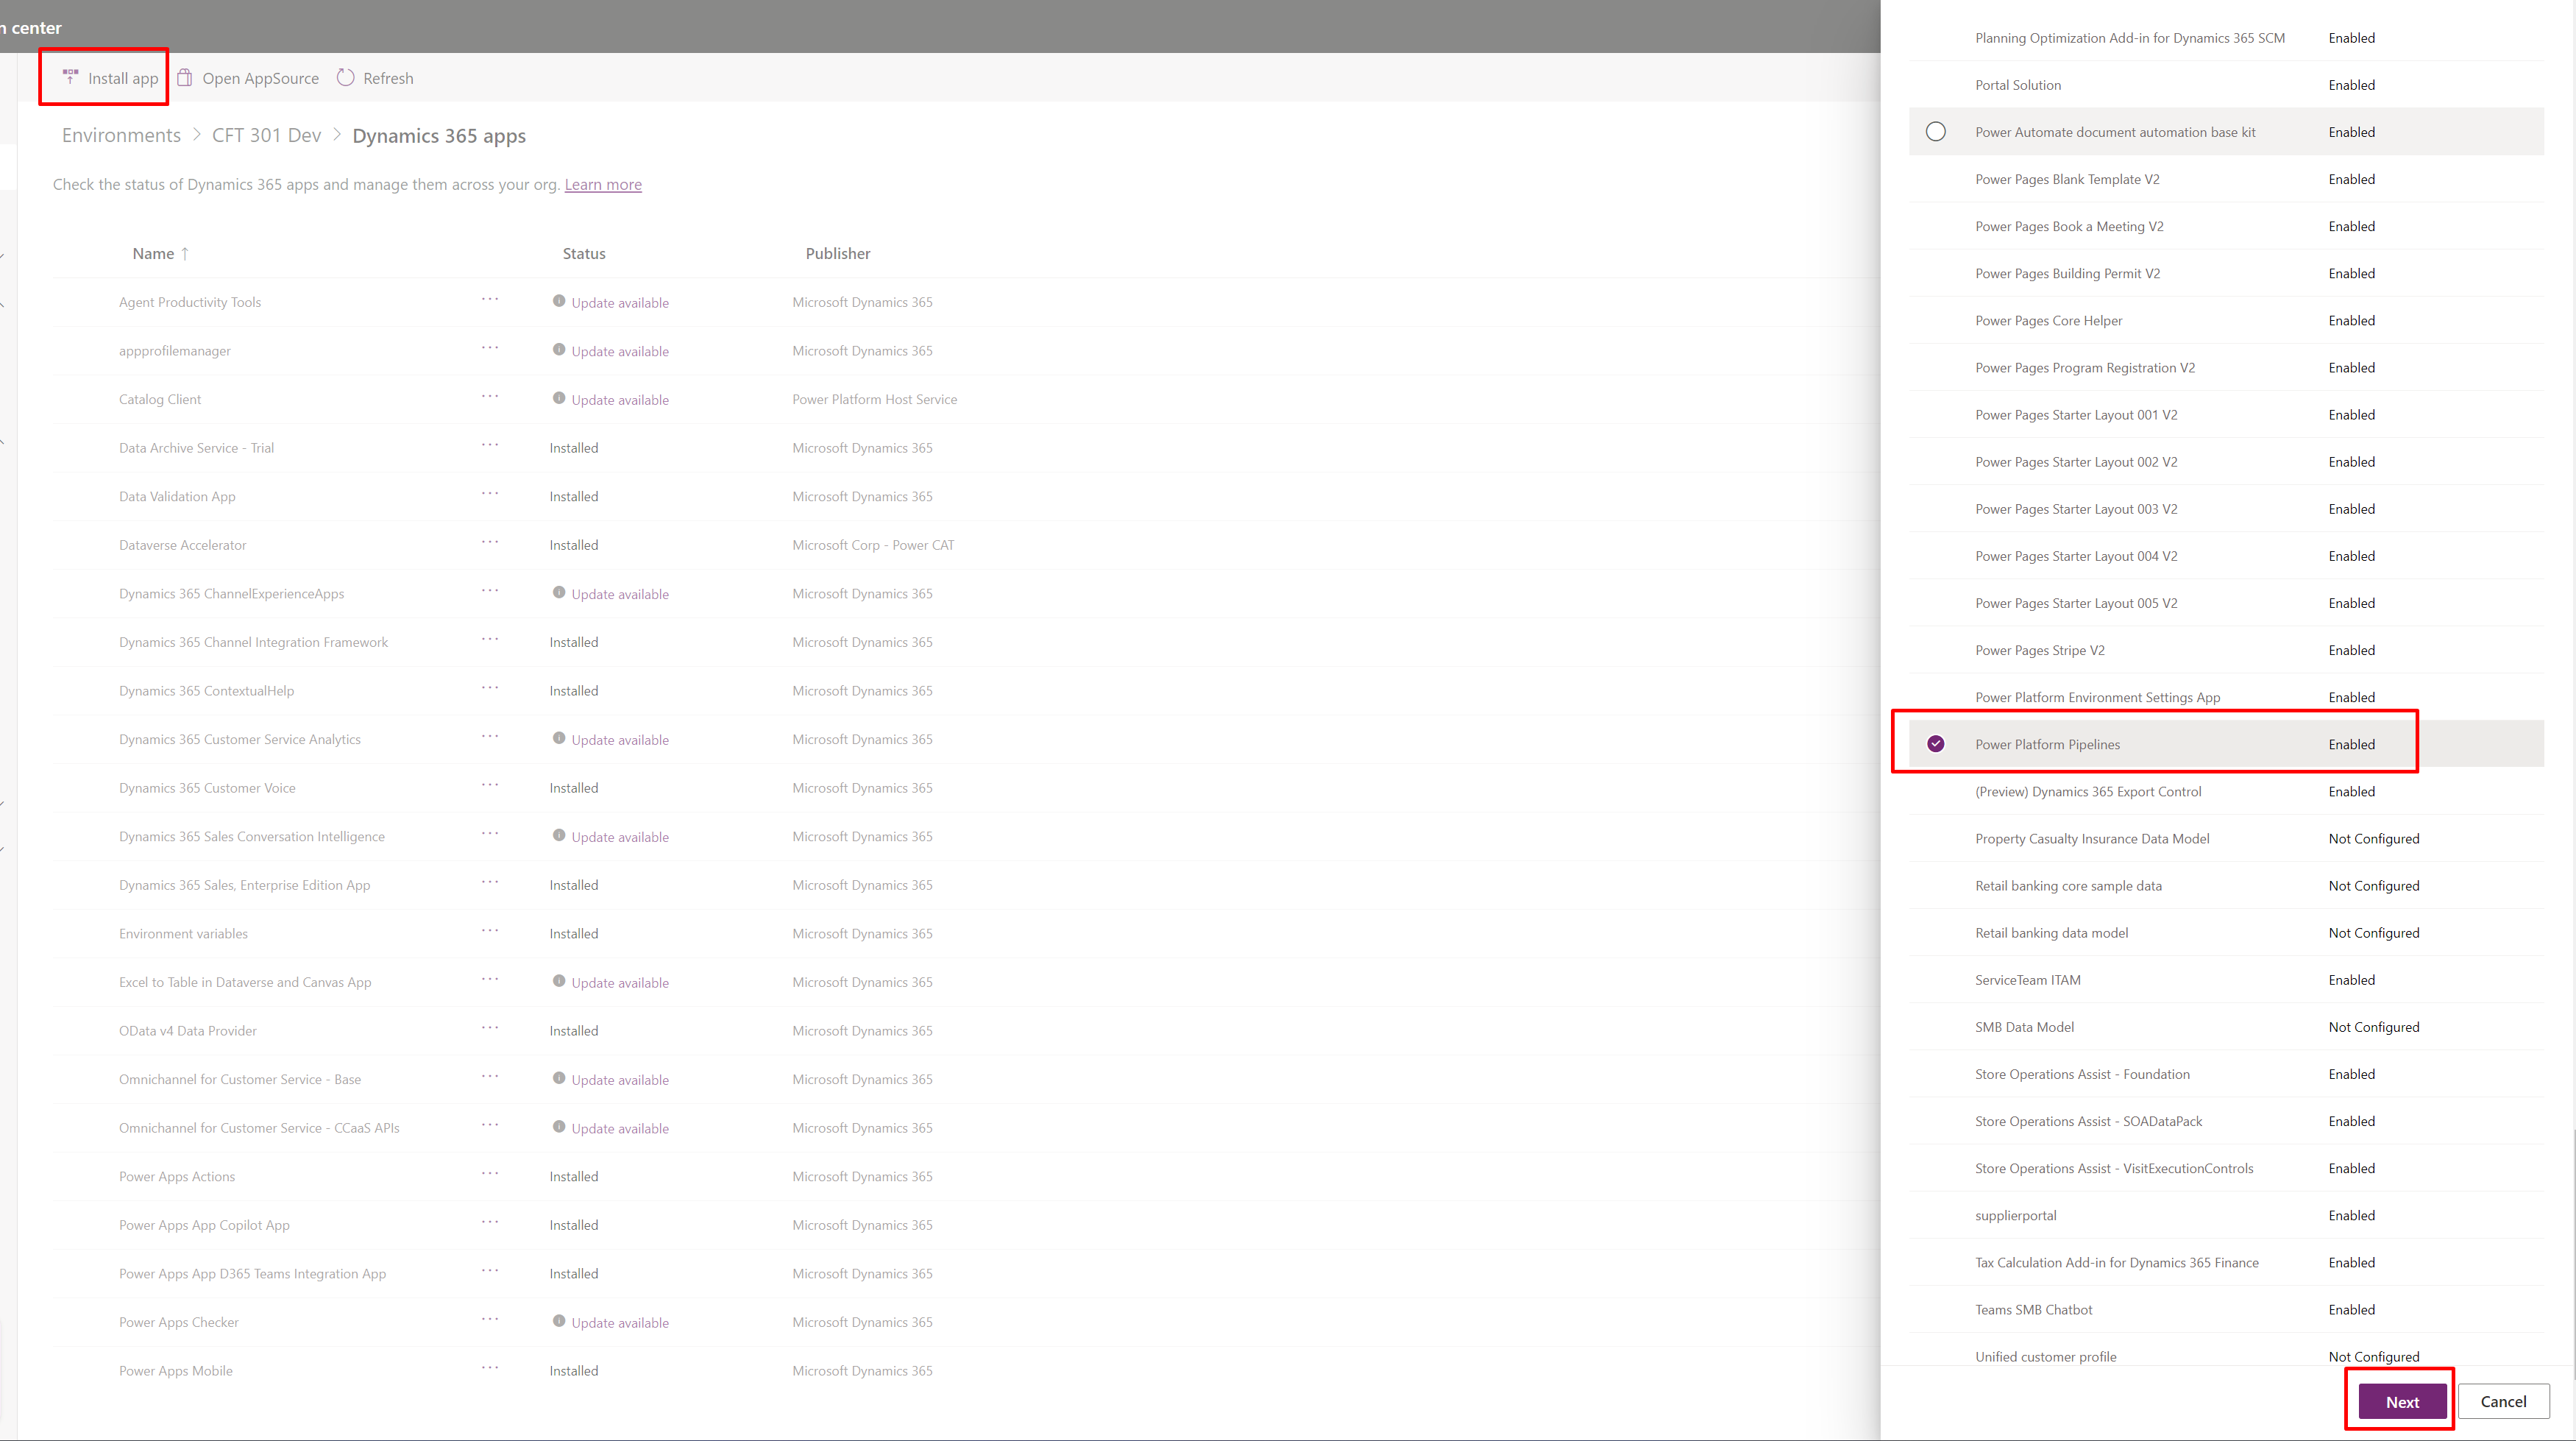
    Given that all participating environments have been enabled with Managed Environments, select an Environment which is supposed to a “Host” environment where all the Pipelines master data will house and then go to it’s Dynamics 365 Apps section from Resources to install Power Platform Pipelines into that environment.

  2. Once you are in, click on Install app and then search for Power Platform Pipelines.

  3. Confirm that you are about to install this Solution.

  4. Once installed, go to Power Apps Maker Portal (https://make.powerapps.com/) and then select the Host environment in which you have installed Power Platform Pipelines on.
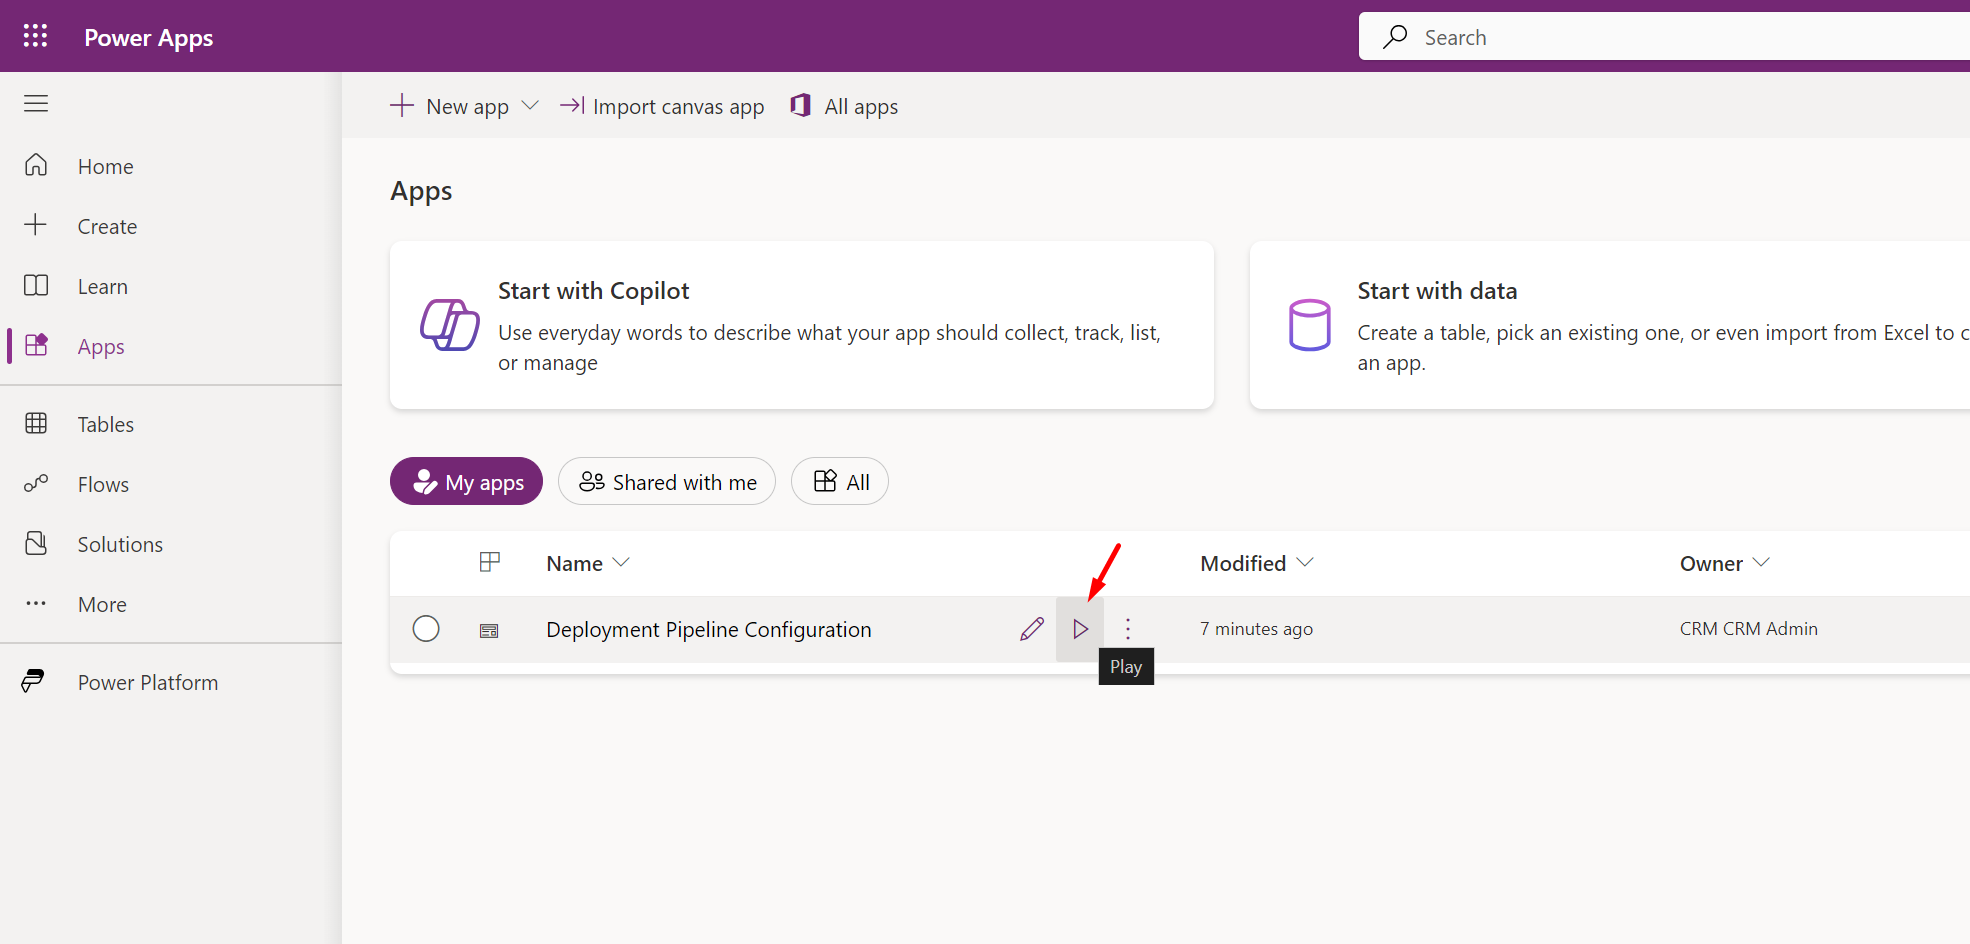
    Then go to Apps and you’ll see Deployment Pipeline Configuration app. Play that app!


    Let’s see how you can set the environments up first!

Setting up Environments

Here’s how you can setup your Environments in the –

  1. Once you are in the Deployment Pipeline Configuration App, go to Environments and create a New record.

  2. Then, enter all the details. Also, mention if the Environment type is Development Environment or Target Environment.

  3. Once you save the record, this the configuration will be validated.


  4. In case you are wondering how to you find the Environment ID, here’s where you’ll find the Environment ID in Power Platform Admin Center (https://admin.powerplatform.microsoft.com/environments), select the environment and you’ll see the details as below –

  5. Once all the Environments are set in the Deployment Manager, here’s how it should look


Configure Deployment Pipelines

Now that your environments are set, let’s also configure the Deployment Pipelines –

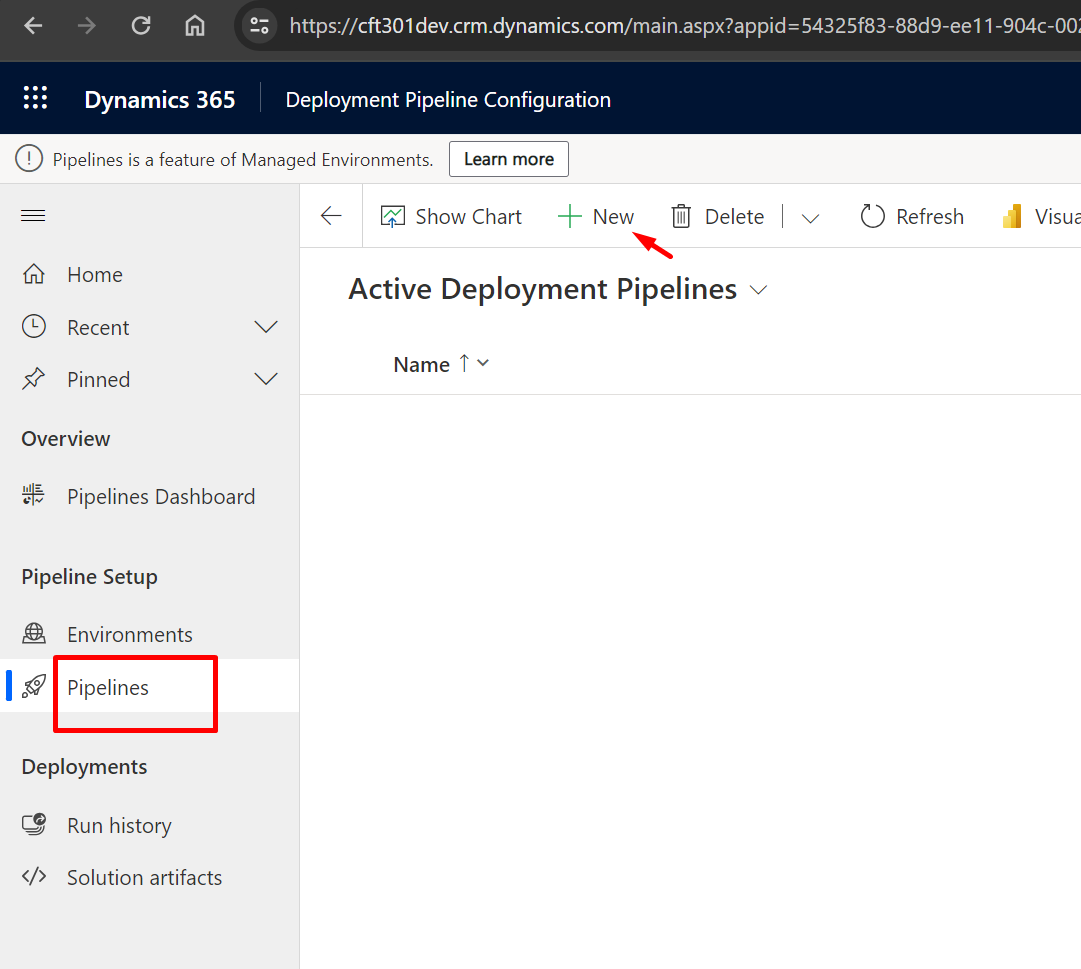
  1. Go to Pipelines and create a New record.

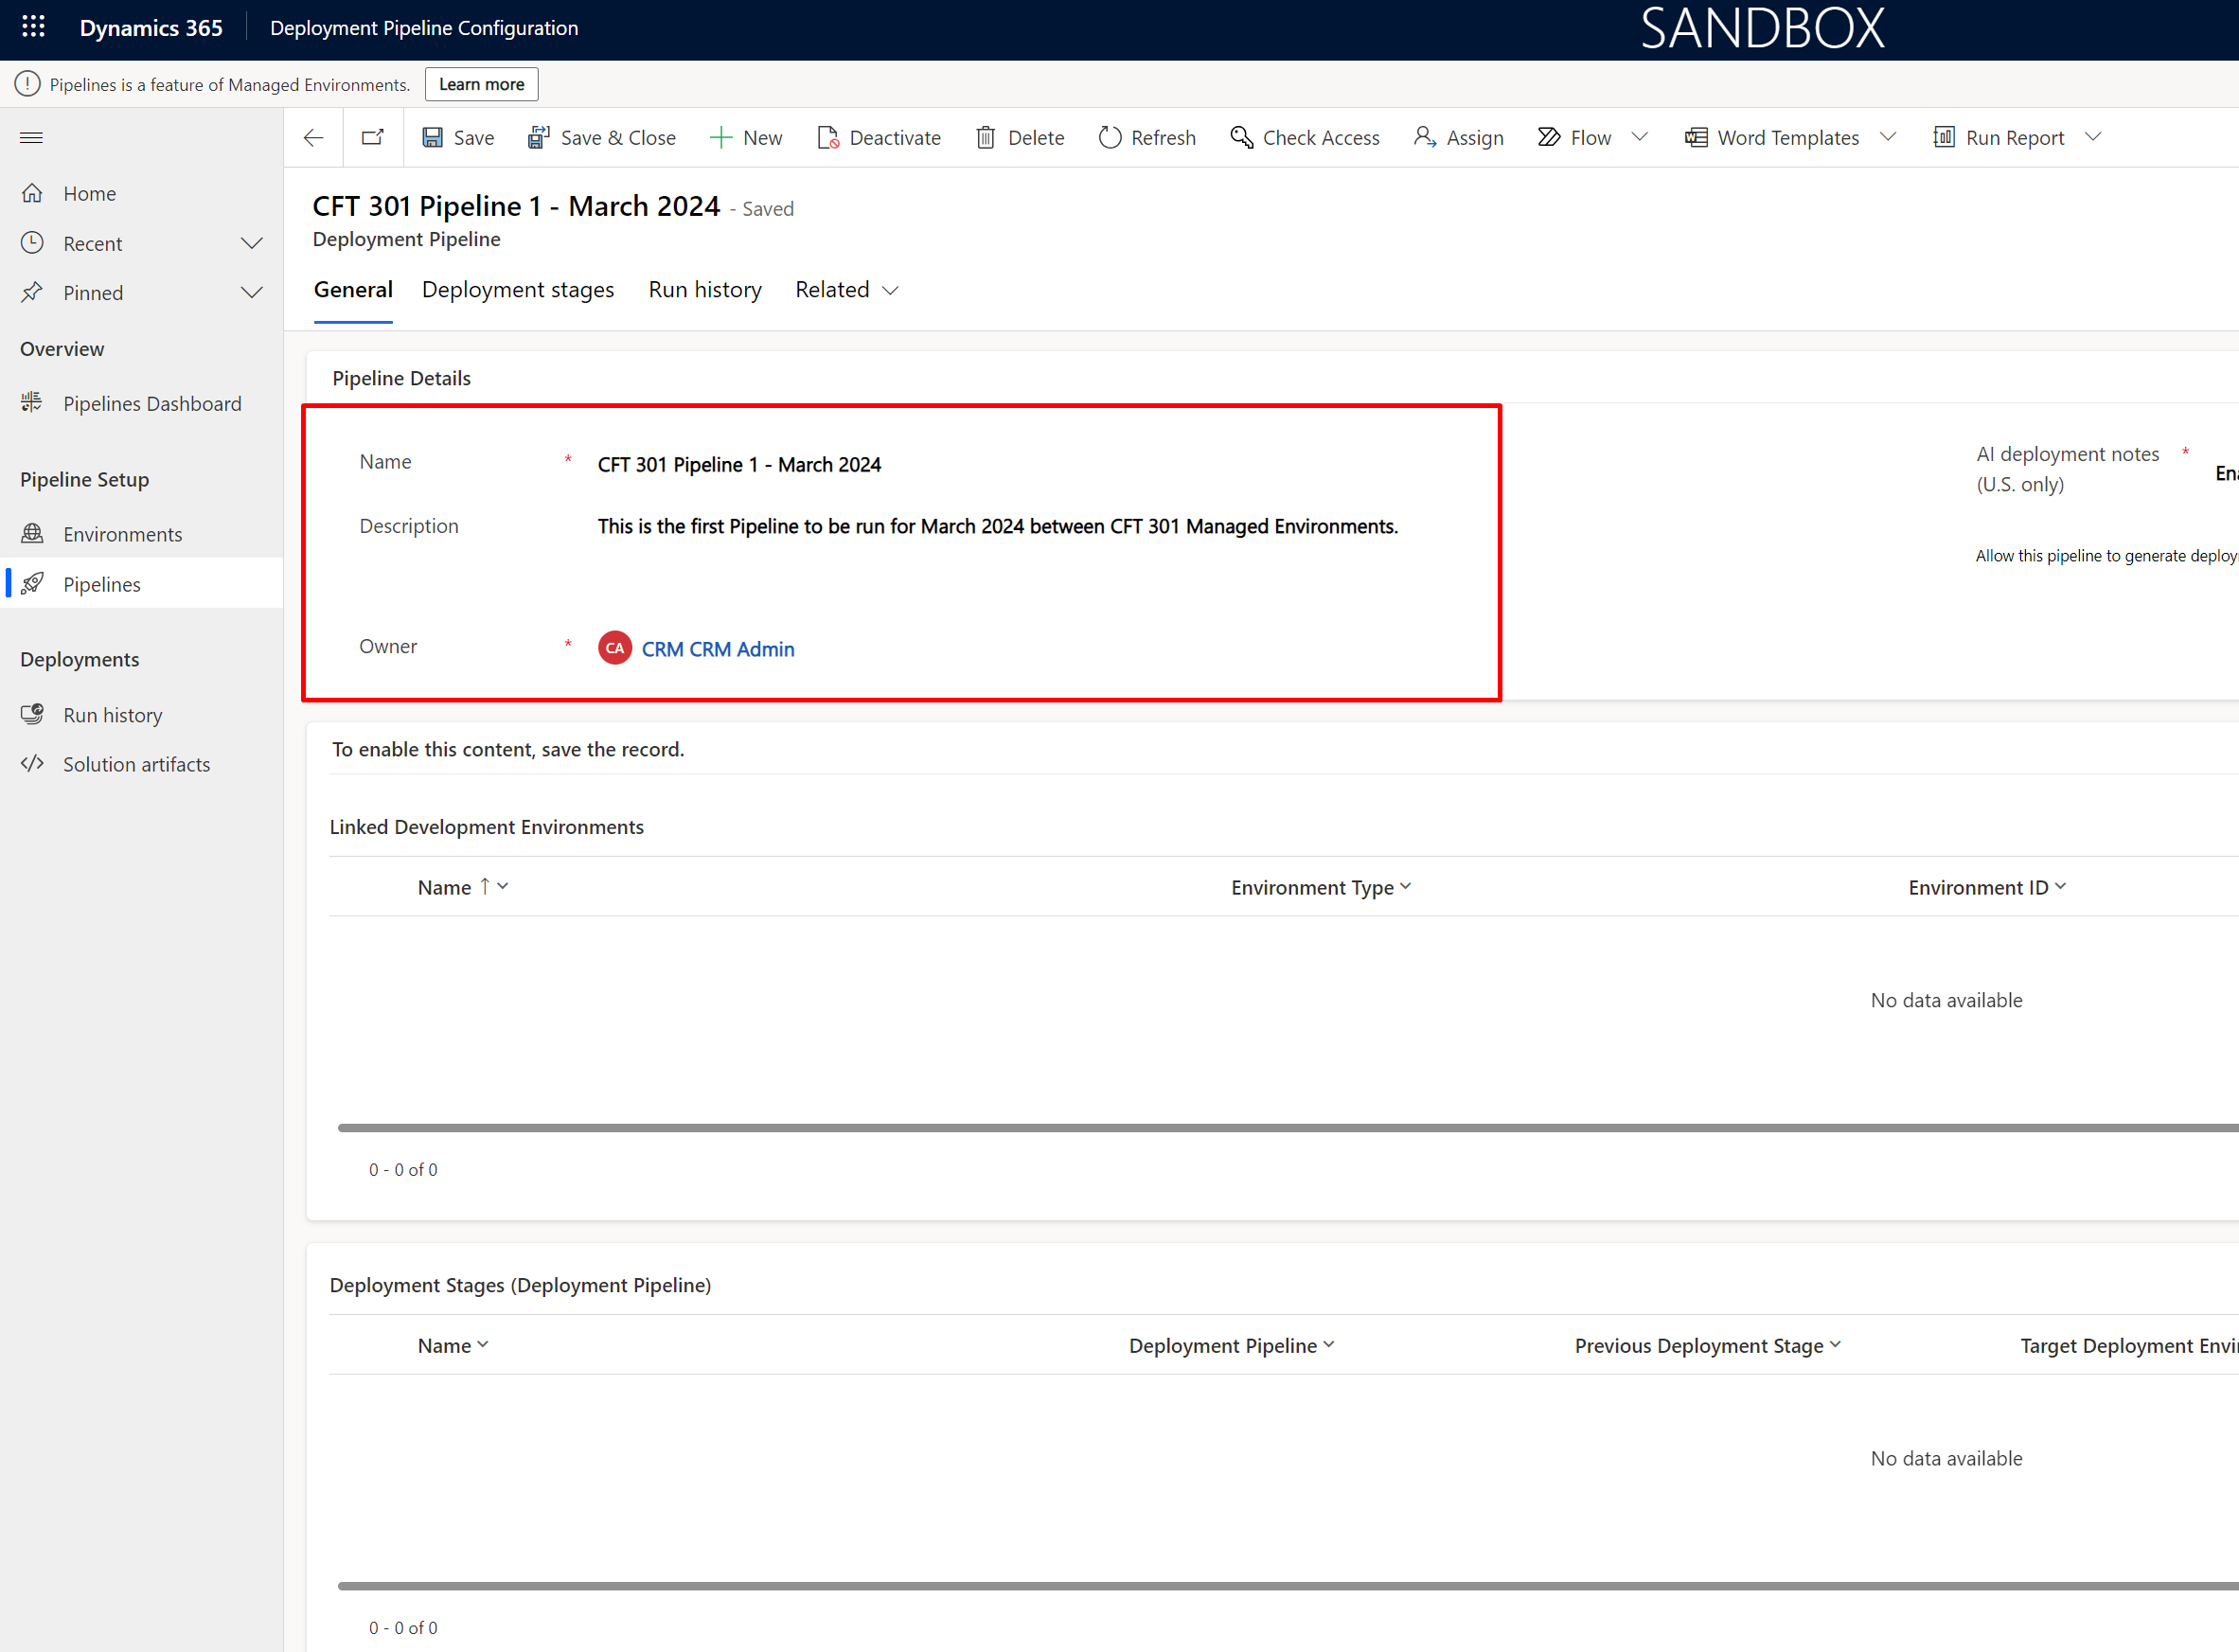
  2. Now, fill in all the relevant information and save the record.

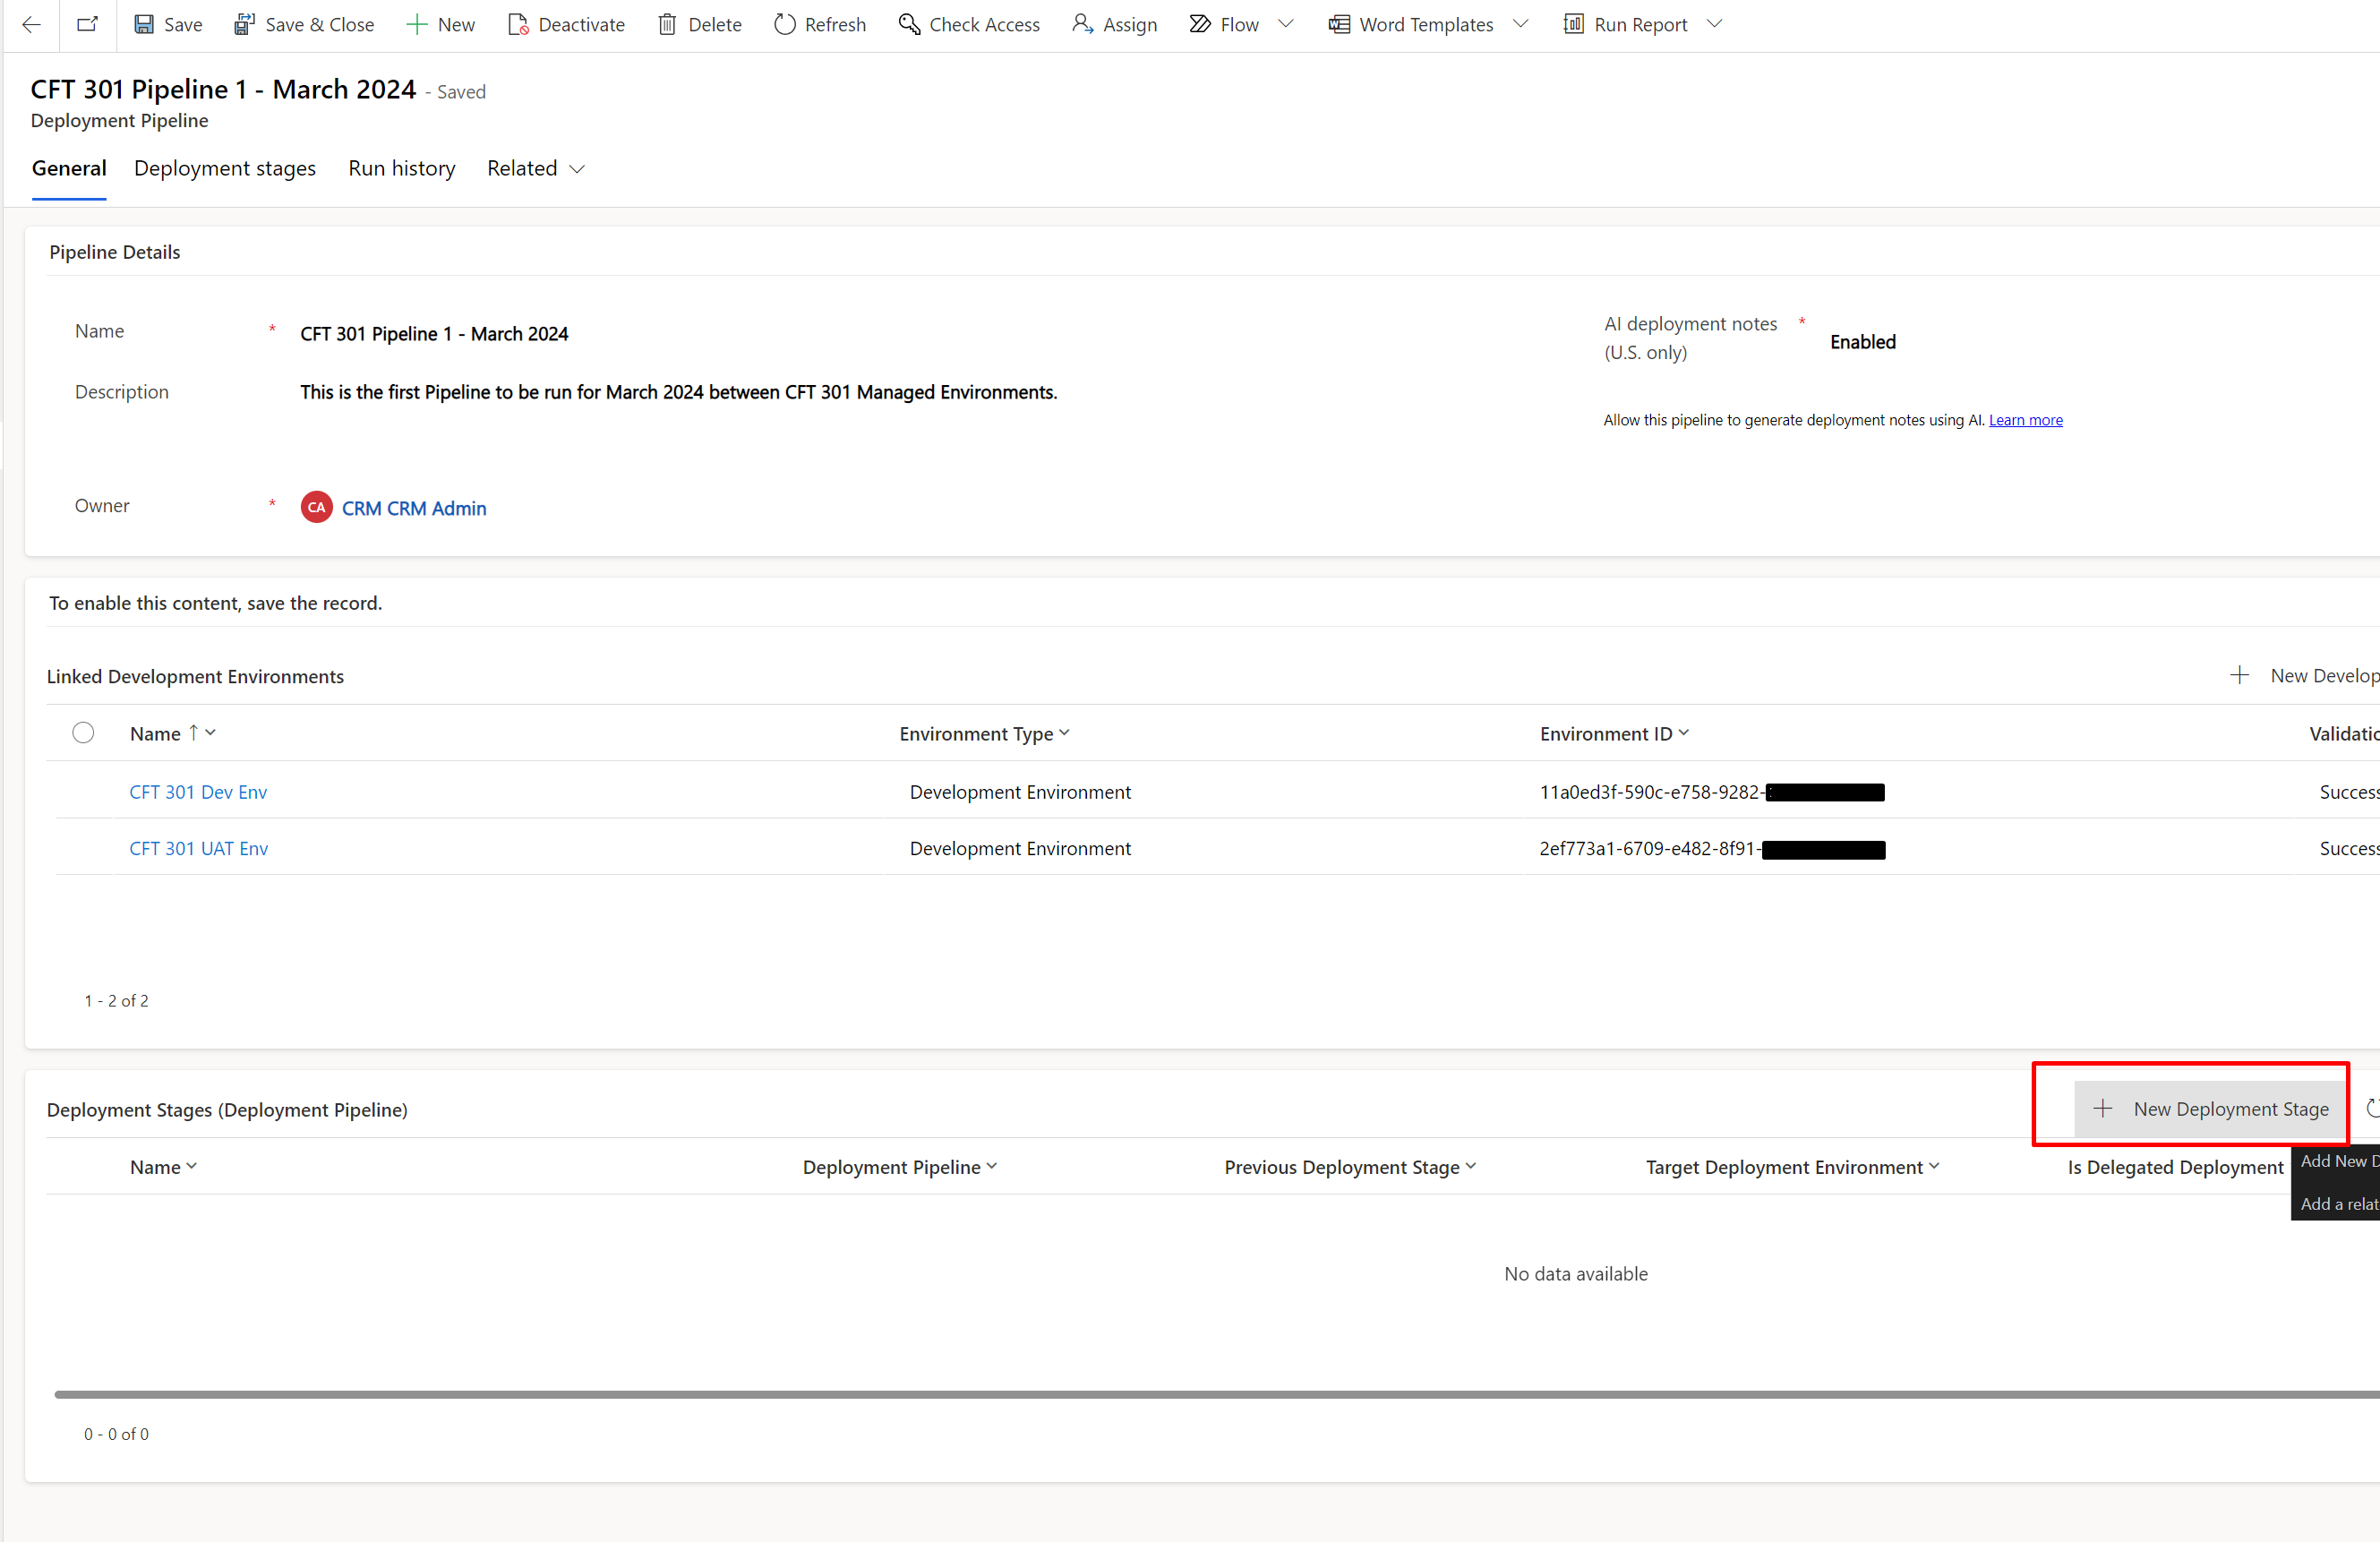
  3. Now, link your Managed Environments in the Linked Deployment Environment grid below. Then click on Add Existing Environments button.

  4. And once you add, they’ll appear like this while selecting them in lookups. Then click Add.

  5. Once added the Development Environments, go ahead and create new Pipeline Stages too.

  6. In the new Deployment Stage, I’ll simply tag the Production Environment and save the record to keep this example simple.

    At this point, your Pipeline is all set to Run.

    Shortly, I’ll share another post on how you can Run a Pipeline in Power Platform!

Hope this was useful!

Thank you!
Pass Entity parameter from Power Automate Flow to an Action

Let’s say that you want to run a Power Automate Flow on a set of Dataverse records and those records will be referenced in your C# Plugins.

And the next steps is you’ll create an Action for this and register it in the Plugin Registration Tool.

In case you are new to plugins in CRM, you can refer this series – Plugins Development in Dynamics 365 CRM for Beginners | [Blog Series]

Bound Action in CRM

Let’s suppose you are aware on how to create Actions in Dynamics 365 CRM. This is an old concept since many years and I’m also assuming you know how to profile a plugin (which is registered as an Action in CRM) –

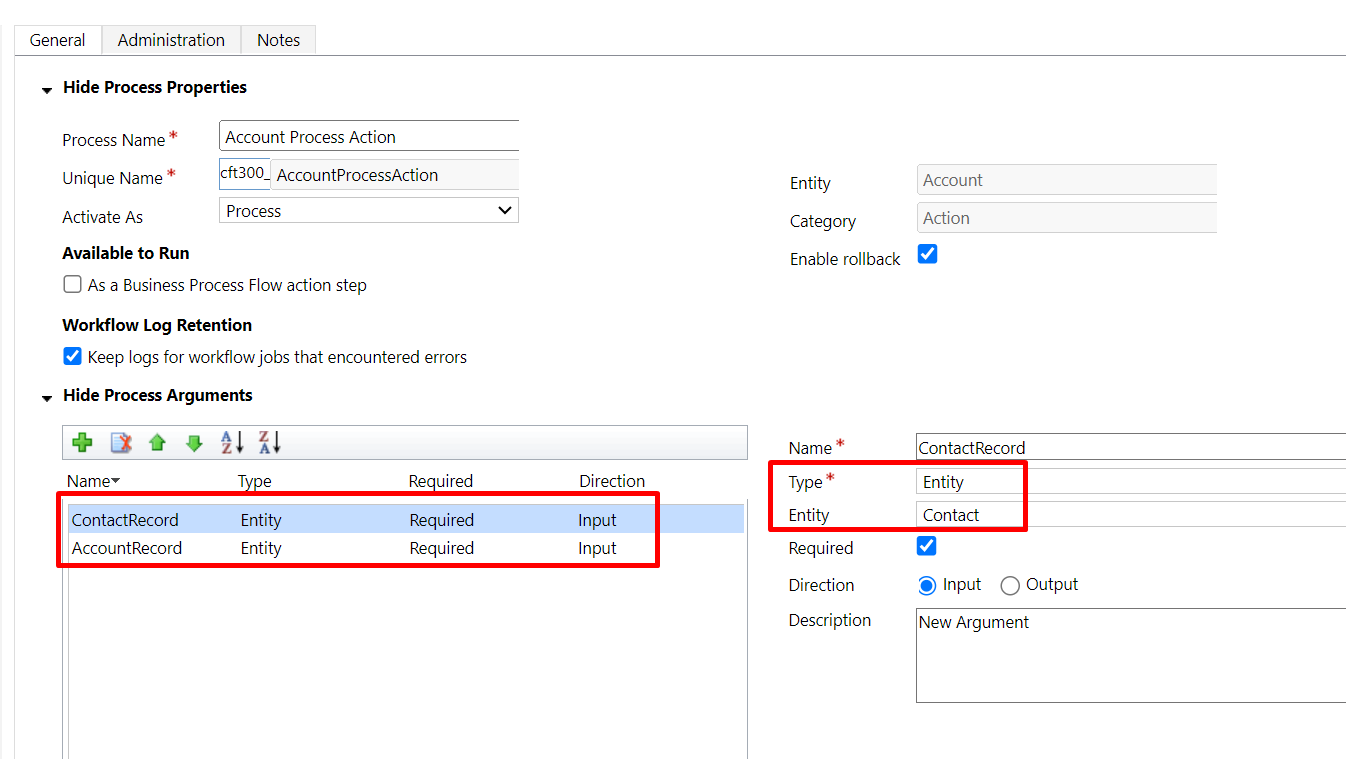
  1. When you open an Action, let’s suppose you are passing Account as well as a Contact Entity to the Action itself.
    Notice that the Action is registered as a Bound Action on the Account entity already.


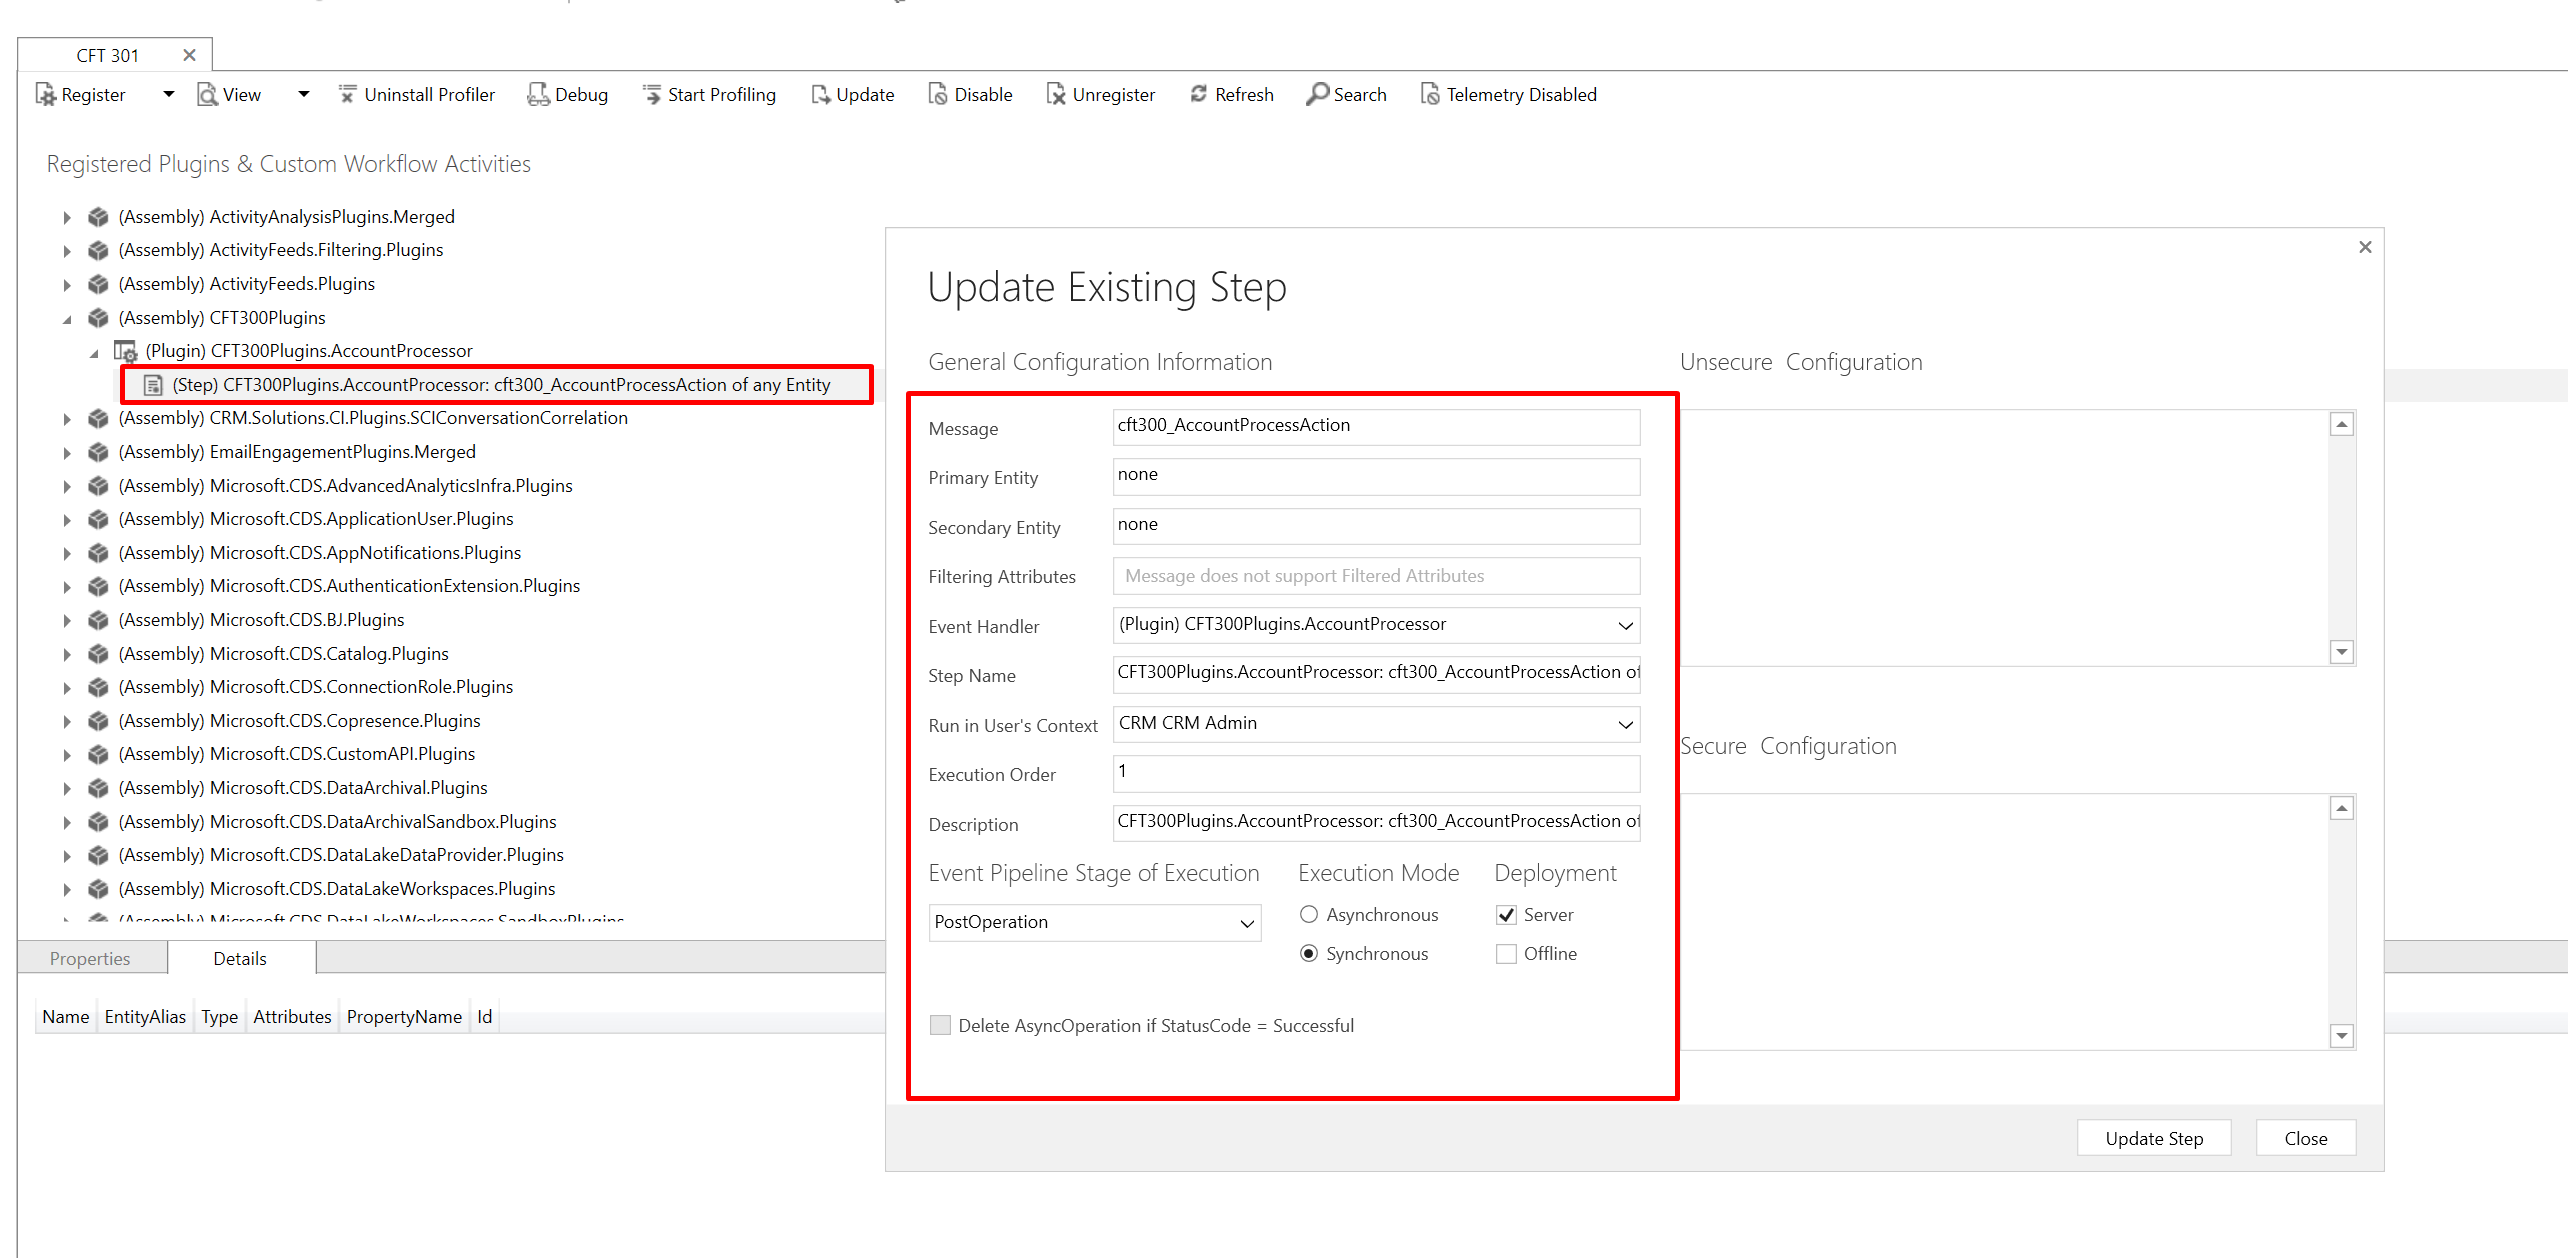
  2. Also, assuming that you have Activated this Action and then registered this Action as a Step on the Plugin in the Plugin Registration Tool.


    Now, let’s see how we can pass the parameters to the plugin itself from the Flow

Power Automate Flow – Bound Action

You must’ve used the Dataverse connector a lot, so here’s how you can call the Bound Action and pass the Entity parameters to the Action itself –

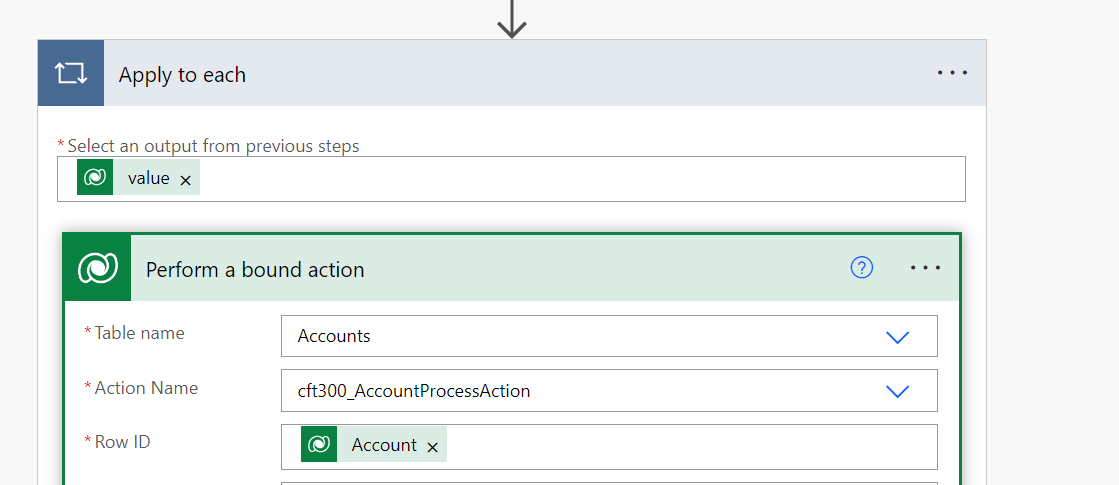
  1. You’ll need to use a Perform a bound action action in Power Automate which is offered by Dataverse connector.

  2. Then, select the Table which you have registered the Action on in CRM and you’ll then see the Action’s backend name appear for selected, then pass the primary key of the record.

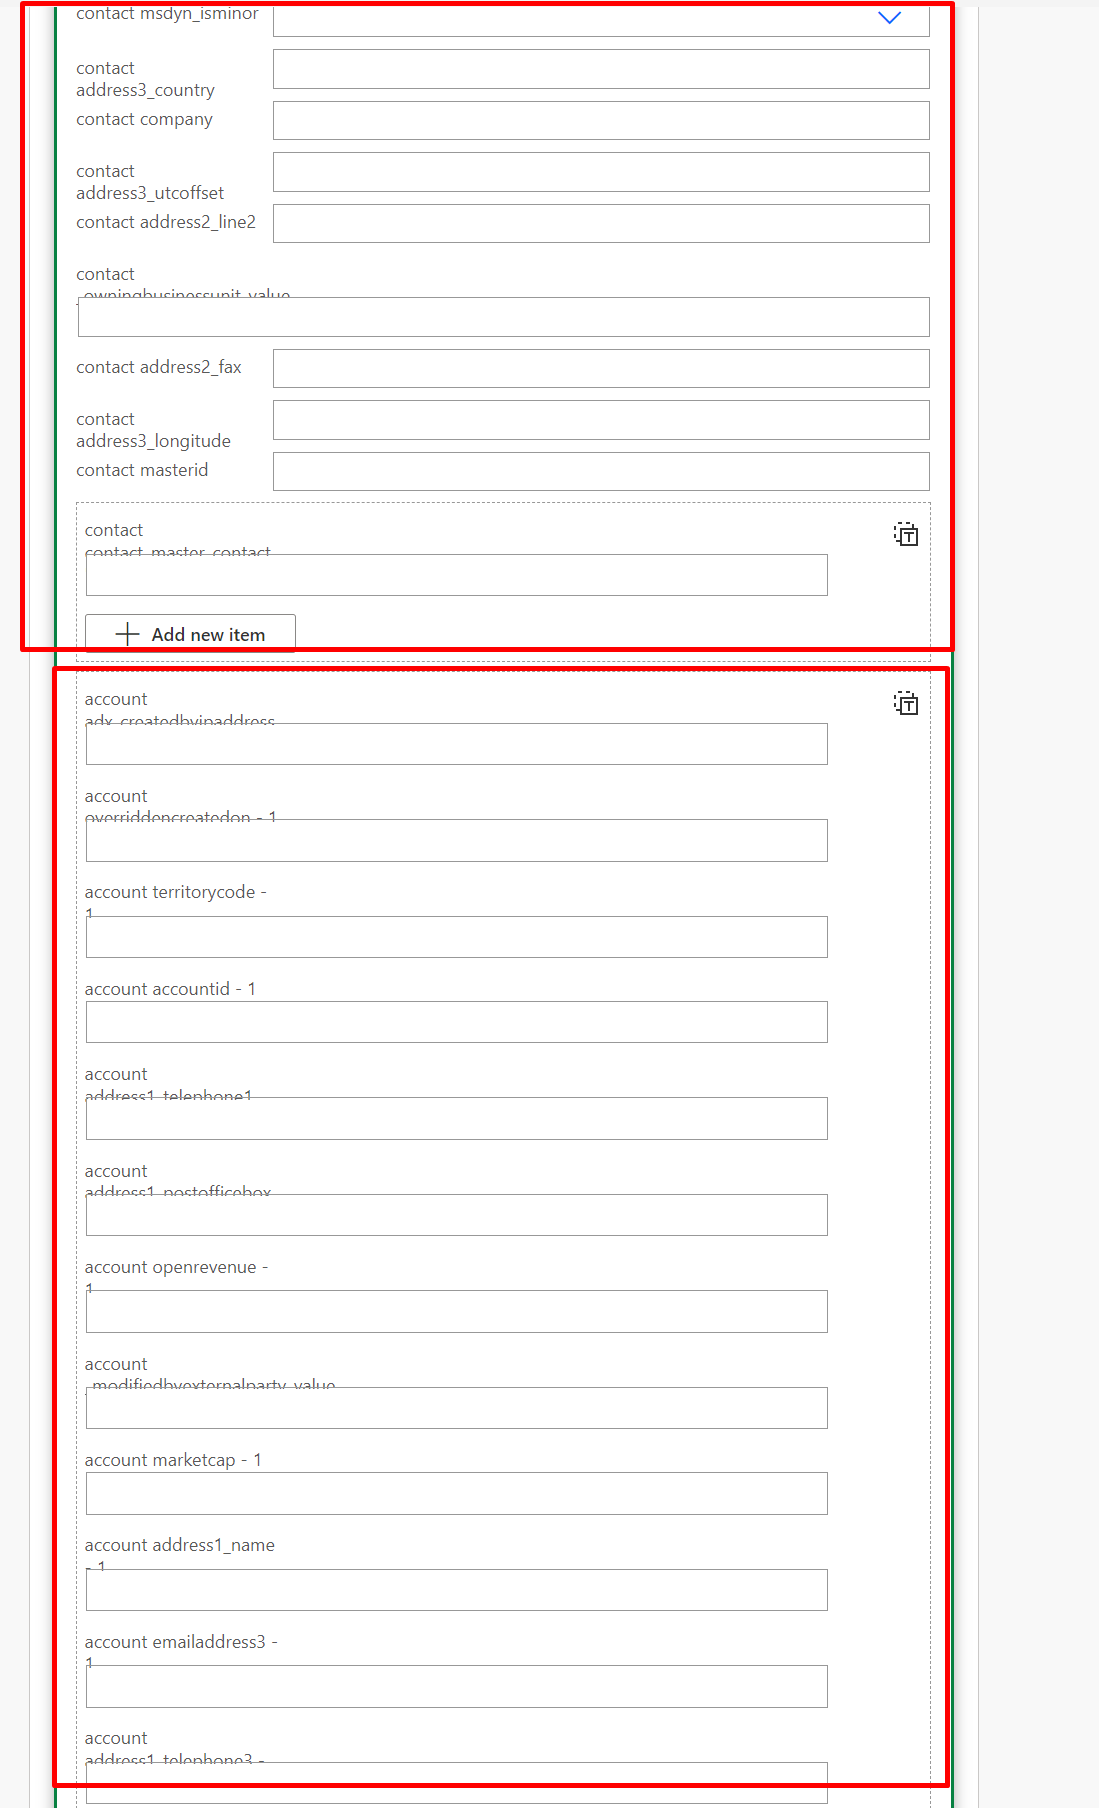
  3. Now, since there are 2 Entity parameters to be passed for the Action, here’s you’ll see all the fields from those Entity itself!

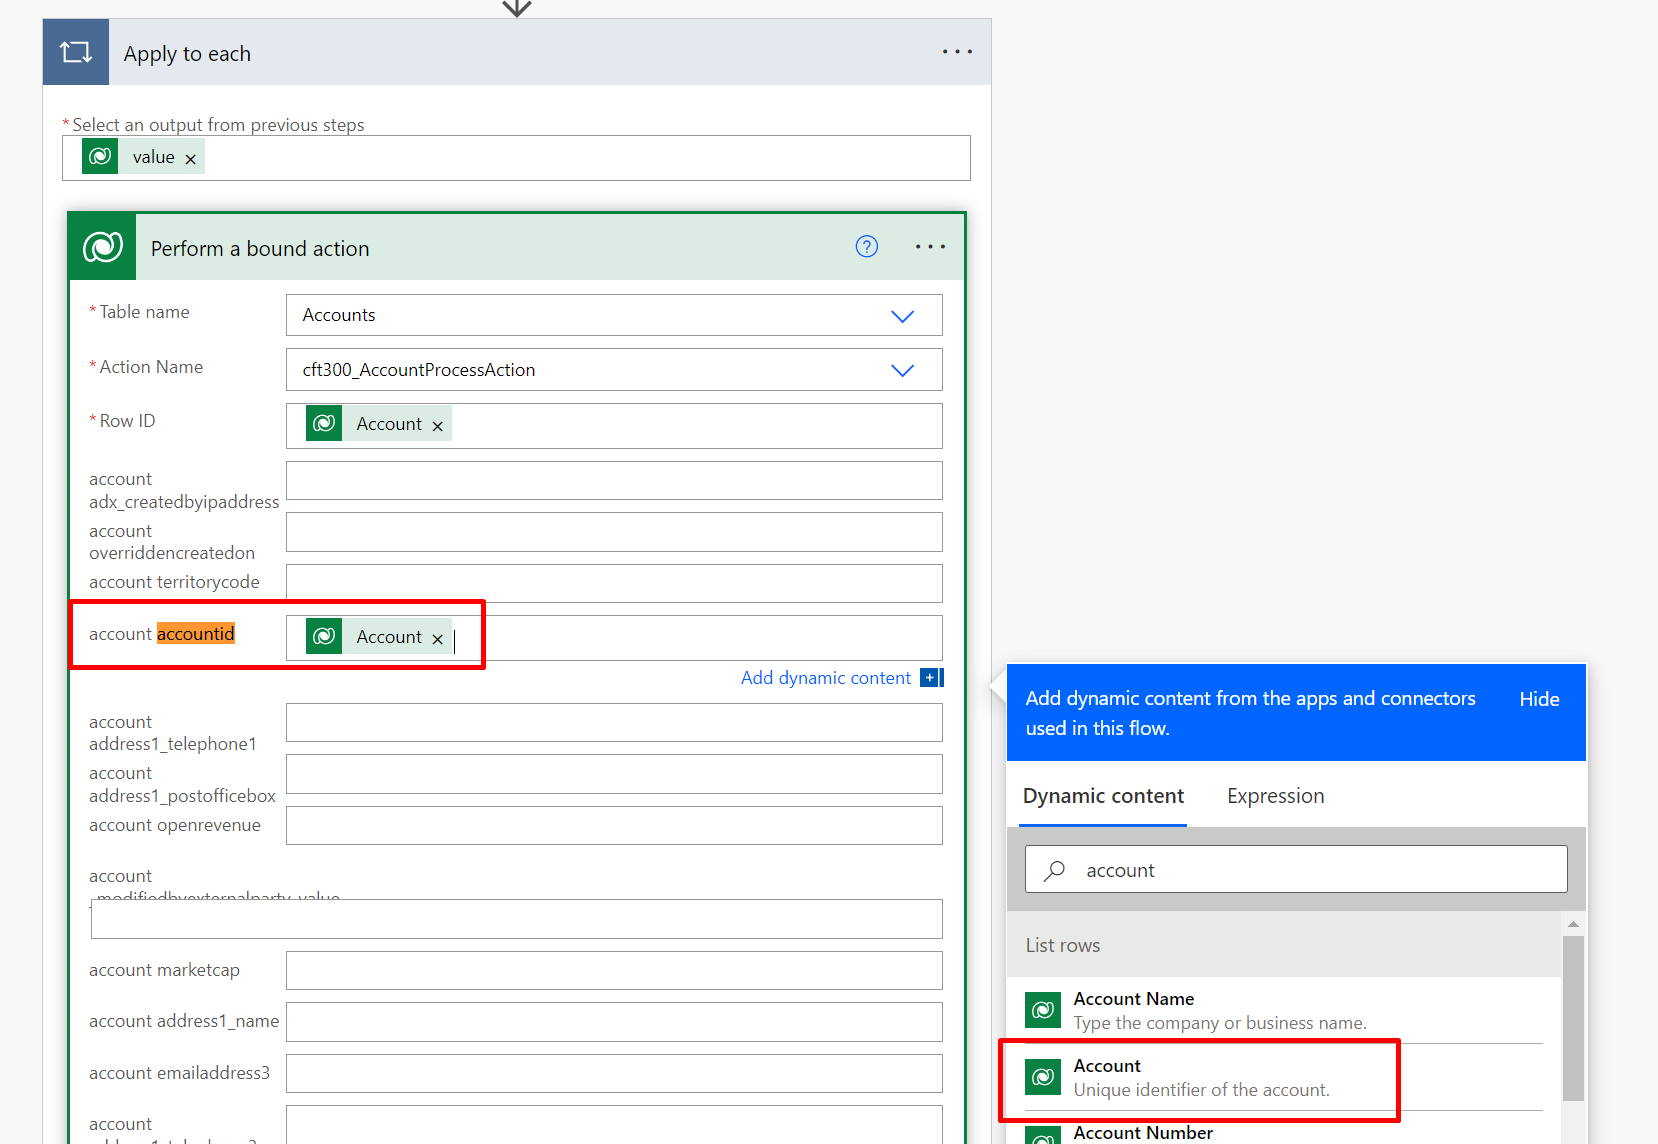
  4. For each of these Entity parameters, you have to look for the Primary Key field of those tables and then pass the GUIDs of the Entity records you presumably have.

  5. But wait! There’s a limitation here. You can only have 1024 parameters saved for the step selected. Hence, only 1 lookup will suffice.
    You’ll get the below error when trying to set both the Lookups that I’m passing to the action above.
    The error says “The dynamic schema response from API ‘commondataserviceforapps‘ operation ‘GetMetadataForBoundActionInput‘ is too large, only schemas with at most 1024 properties are supported.

  6. Hence, I’ll go back and remove 1 Entity parameters just for this example to work!

  7. And then, I’ll simply profile the Plugin Action to see what is passed in the InputParameters.

Plugin Context

Now, given that you might have already Profiled the plugin and attached it to the Plugin Registration Tool process, let’s examine the context’s Input Parameters –

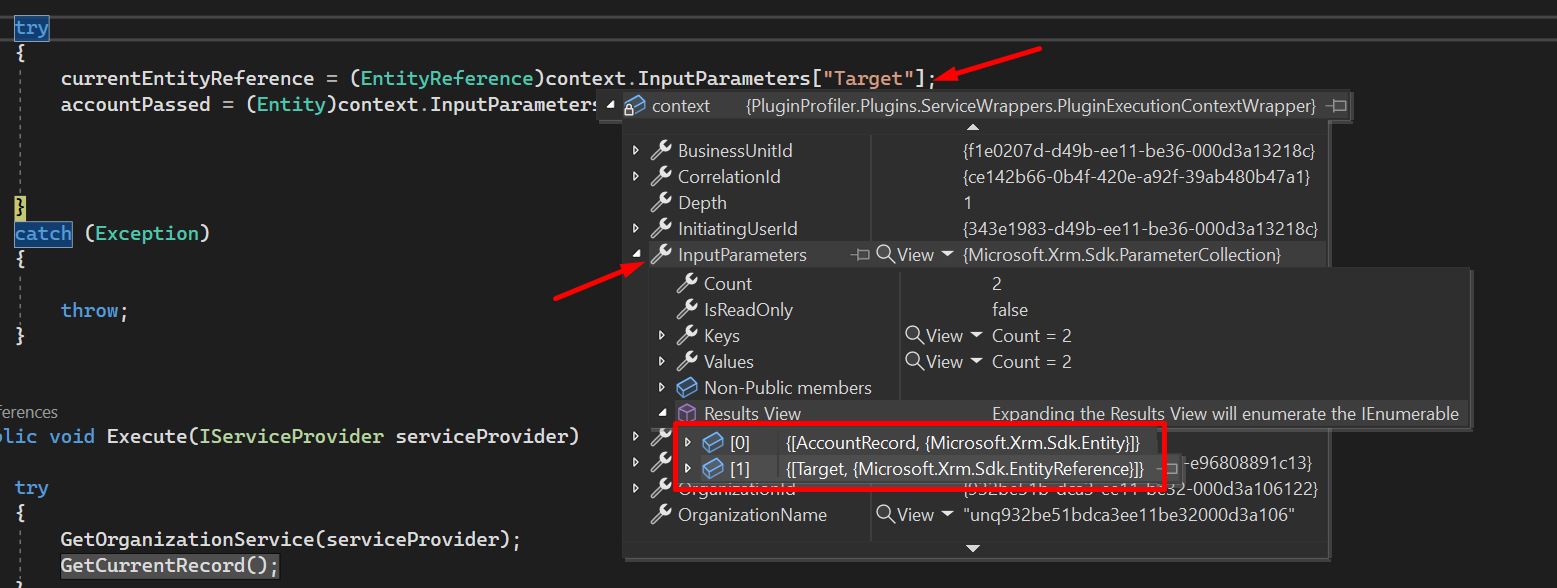
  1. the InputParameters in the plugin’s execution context will contain the following parameters, which we’ll see in later section of this blog post.
    Target [EntityReference, in a CRUD operation registered plugin step – Target is an Entity in the plugin context]
    AccountRecord [Entity]

Considerations

Here are some considerations if you want to make design decisions for your implementation –

  1. Cannot have 2 or more Entities as parameters as the Perform a bound action step itself has limitations of 1024 properties at the Power Automate level.
  2. Pass some other Entity than the Action you have registered on since you’ll get the registered Entity as EntityReference itself in the “Target” parameter.

Hope this was useful!

Thank you!